Markets Strengthen Despite Negative Yield Curve
By Colin Twiggs
August 4, 2006 2:23 a.m. ET
August 4, 2006 2:23 a.m. ET
Apologies for the irregular timing of the newsletter. I am
traveling and find the different time zones quite
disruptive.
These extracts from my daily trading diary are for educational purposes and should not be interpreted as investment advice. Full terms and conditions can be found at Terms of Use.
These extracts from my daily trading diary are for educational purposes and should not be interpreted as investment advice. Full terms and conditions can be found at Terms of Use.
The Big Picture
The Dow and S&P 500
have so far withstood the recent bearish sentiment and now show
signs of strengthening. In addition, the Nasdaq
100 and Dow Transport Index are
consolidating below the new resistance level. The FTSE and ASX show signs of
recovery, but should be treated with caution because of the
potential domino effect from the US. The Nikkei is consolidating with no clear
trend.
The markets still have to cope with the yield differential which has turned negative and the possibility of another rate rise on August 8. Annual core consumer price index figures of 2.4% mean that the Fed is unlikely to pause yet in its cycle of rate hikes. This further increases the risk of an economic down-turn according to the Wright model. The probability of recession in the next four quarters is currently 27% and rising.
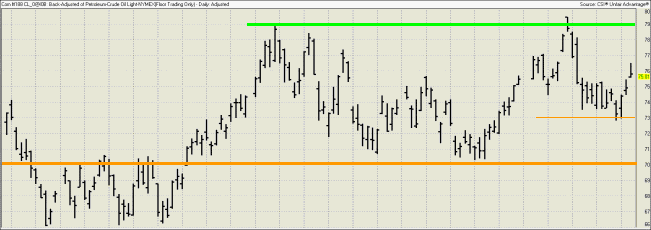
Gold is strengthening, along with crude oil, as the dollar weakens.
The markets still have to cope with the yield differential which has turned negative and the possibility of another rate rise on August 8. Annual core consumer price index figures of 2.4% mean that the Fed is unlikely to pause yet in its cycle of rate hikes. This further increases the risk of an economic down-turn according to the Wright model. The probability of recession in the next four quarters is currently 27% and rising.
Gold is strengthening, along with crude oil, as the dollar weakens.
USA
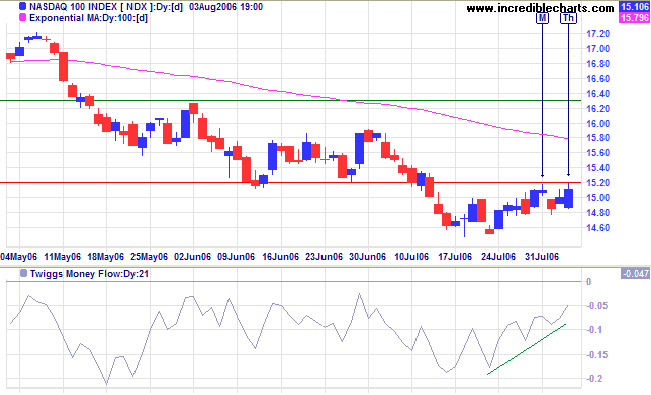
Our two leading indicators at present are the Nasdaq 100 and
the Dow Jones Transportation Average, both of which show signs
of improvement.
The Nasdaq 100 again tested resistance at 1520 after breaking below the primary support level. A close below 1450 would confirm the primary down-trend, but consolidation below the resistance level signals trend weakness -- and a close above this level would be a bullish sign. Twiggs Money Flow (21-day) is below zero but rising: early signs of accumulation.
The Nasdaq 100 again tested resistance at 1520 after breaking below the primary support level. A close below 1450 would confirm the primary down-trend, but consolidation below the resistance level signals trend weakness -- and a close above this level would be a bullish sign. Twiggs Money Flow (21-day) is below zero but rising: early signs of accumulation.
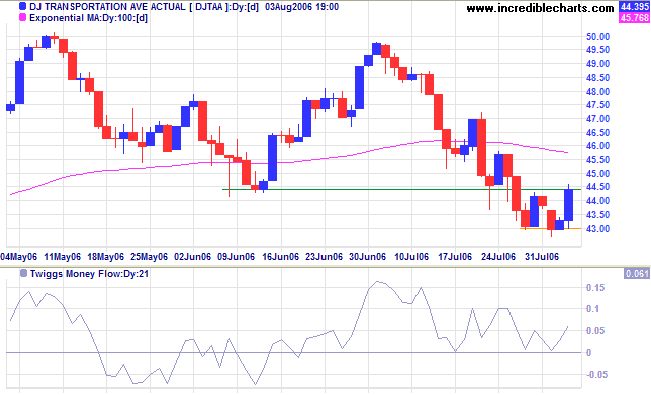
The Dow Jones Transportation Average displays similar
consolidation below resistance at 4450 despite the recent fall
in UPS. A fall below 4300 would confirm the down-trend, but a
close above 4450 would be a bull signal, indicating
insufficient sellers to drive price lower.
Twiggs Money Flow (21-day) signals
accumulation: holding above the zero line
The Dow Industrial Average is testing resistance at
11250. A bullish sign is the short retracement on
Monday/Tuesday.
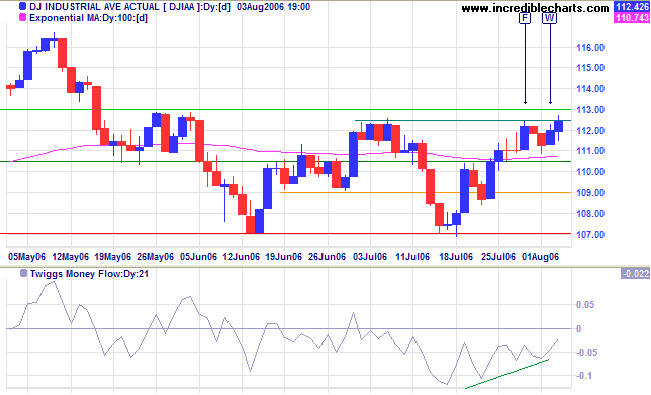
Medium Term: Expect a close above 11250 to signal
completion of a bullish
double bottom with a target close to the May high of 11650.
Though unlikely at this stage, a fall below 11000 would mean
another test of primary support at 10700.
Twiggs Money Flow (21-day) is below zero but rising:
showing early signs of
accumulation.
Long Term: The Dow is in a primary up-trend, but a fall below 10700 would mean reversal.
Long Term: The Dow is in a primary up-trend, but a fall below 10700 would mean reversal.
The S&P 500 is threatening an upward breakout from a
bullish
ascending triangle (highlighted by the dark blue and light
green lines below). The short retracement on
Monday/Tuesday is a further bull signal and we can expect a
breakout above 1280.
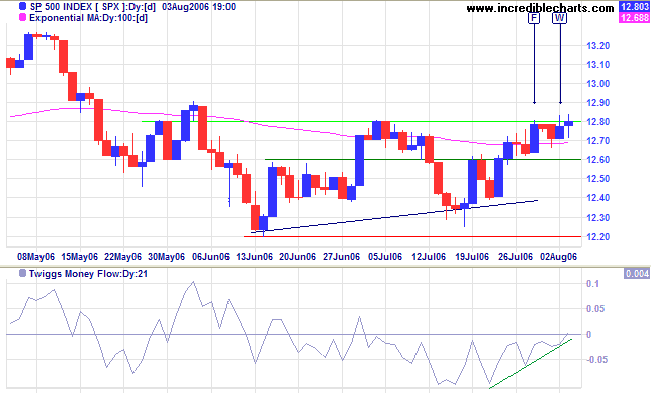
Medium Term: A rise above 1280 would signal a test of
the May high of 1325.
Twiggs Money Flow (21-day) is rising, signaling early
accumulation.
Long Term: The S&P 500 is in a slow up-trend, with primary support at 1220.
Long Term: The S&P 500 is in a slow up-trend, with primary support at 1220.
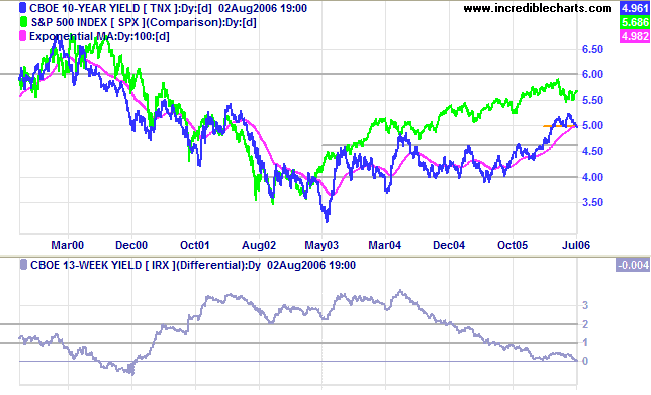
Treasury yields
The yield on 10-year Treasury notes is testing support at 5.0%.
Medium Term: Long-bond yields are likely to continue in an up-trend.
Long Term: The yield differential (10-year T-notes minus 13-week T-bills) has fallen below zero, making the economy extremely vulnerable.
The yield on 10-year Treasury notes is testing support at 5.0%.
Medium Term: Long-bond yields are likely to continue in an up-trend.
Long Term: The yield differential (10-year T-notes minus 13-week T-bills) has fallen below zero, making the economy extremely vulnerable.
The probability of recession in the next four quarters has
risen to 27 per cent, according to the Wright
Model developed by Fed economist Jonathan H Wright.
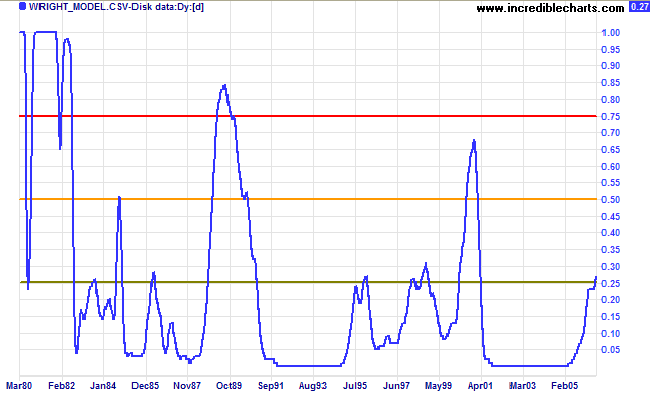
The three colors on the Wright chart should be interpreted as
follows:
- probability rises above 25%: while not yet cause for concern, watch the indicator regularly for signs of further deterioration;
- above 50%: the situation is becoming volatile -- so exercise caution;
- above 75% means dire risk of an economic downturn.
Gold
Spot gold is rallying to test resistance at $680.
Medium Term: Failure to break out above $680 would be a bear signal (two lower highs after the May peak), placing support at $600 under threat. A fall below $600 would be an even stronger bear signal.
Long Term: The primary up-trend continues, with primary support at $540/$550.
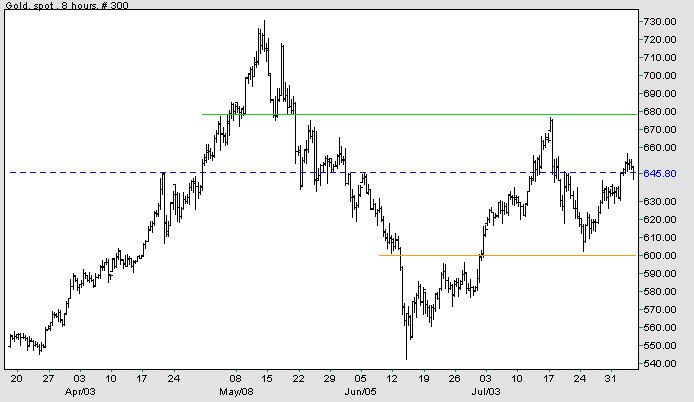
Source: Netdania
Crude Oil
Light Crude appears headed for another test of resistance at $80 after forming a bullish higher low at $73/barrel. Breakout above $80 would signal another up-trend, while reversal below $73 would mean a test of primary support at $70.
Light Crude appears headed for another test of resistance at $80 after forming a bullish higher low at $73/barrel. Breakout above $80 would signal another up-trend, while reversal below $73 would mean a test of primary support at $70.
Currencies
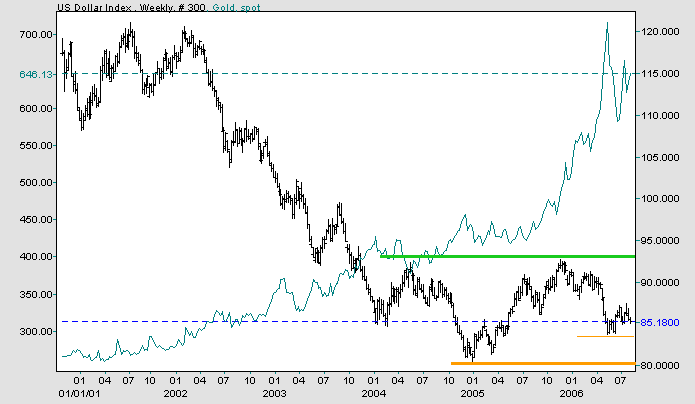
The dollar is weakening against major trading partners in the short-term.
The US Dollar Index is likely to test support at 83/84 in the weeks ahead. A close below this level would mean a test of the 5-year low at 80 (and a bullish sign for gold).
The dollar is weakening against major trading partners in the short-term.
The US Dollar Index is likely to test support at 83/84 in the weeks ahead. A close below this level would mean a test of the 5-year low at 80 (and a bullish sign for gold).
Source: Netdania
United Kingdom
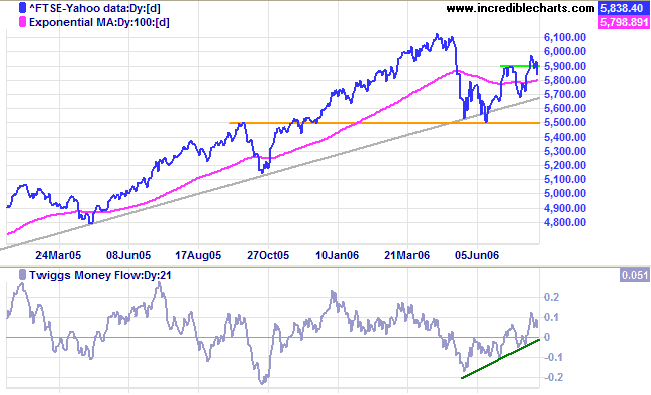
The FTSE 100 is trending slowly upwards, whipsawing around the 100-day exponential moving average, and appears headed for another test of 6130.
Medium Term: Reversal below 5700 would signal another test of primary support at 5500. Twiggs Money Flow (21-day) is trending upwards, signaling accumulation.
Long Term: The primary up-trend is intact.
Japan
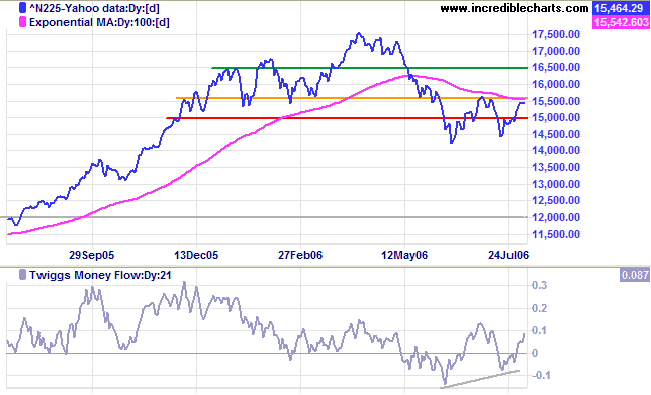
The Nikkei 225 is testing resistance at 15500/15600.
Medium Term: A higher trough on Twiggs Money Flow (21-day) signals accumulation. A fall below 14200 would confirm the primary down-trend.
Long Term: The index is consolidating with no clear trend as yet. A close above 15600 would signal reversal to a primary up-trend.
ASX Australia
The All Ordinaries is consolidating in a narrow band between 4880 and 4980. The consolidation is unusually positioned half way between the high and low, indicating market uncertainty. A rise above 4980 would be bullish, signaling an up-trend if the index is able to break through resistance at 5100. However, a fall below 4880 would mean another test of primary support at 4800.
The All Ordinaries is consolidating in a narrow band between 4880 and 4980. The consolidation is unusually positioned half way between the high and low, indicating market uncertainty. A rise above 4980 would be bullish, signaling an up-trend if the index is able to break through resistance at 5100. However, a fall below 4880 would mean another test of primary support at 4800.
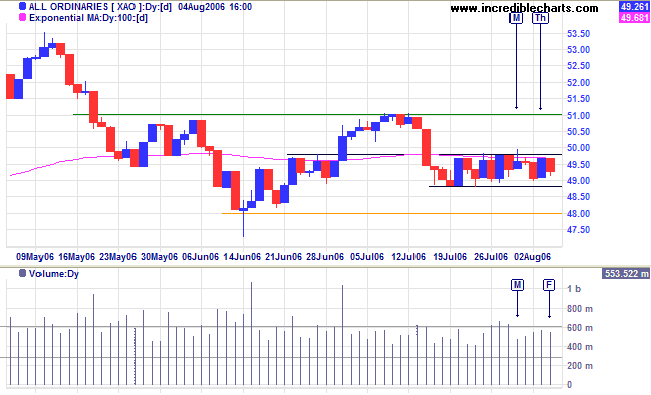
Medium Term: A rise above 5100 would indicate that a
test of the upper channel line is likely.
Twiggs Money Flow (21-day) whipsawing around zero signals
uncertainty.
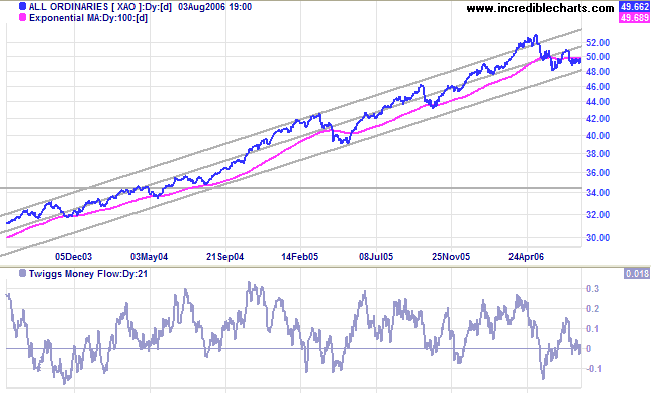
Long Term: The All Ordinaries is in a primary up-trend,
but a close below support at 4800 would change this.
The conservation of natural resources is the
fundamental problem.
Unless we solve that problem it will avail us little to solve all others.
~ Theodore Roosevelt, October 1907.
Unless we solve that problem it will avail us little to solve all others.
~ Theodore Roosevelt, October 1907.
For more background information, read About
the Trading Diary.

Author: Colin Twiggs is a former investment banker with almost 40 years of experience in financial markets. He co-founded Incredible Charts and writes the popular Trading Diary and Patient Investor newsletters.
Using a top-down approach, Colin identifies key macro trends in the global economy before evaluating selected opportunities using a combination of fundamental and technical analysis.
Focusing on interest rates and financial market liquidity as primary drivers of the economic cycle, he warned of the 2008/2009 and 2020 bear markets well ahead of actual events.
He founded PVT Capital (AFSL No. 546090) in May 2023, which offers investment strategy and advice to wholesale clients.