Nasdaq Primary Trend Reverses
By Colin Twiggs
July 13, 2006
July 13, 2006
We will be trialing a mid-week update for the next few weeks,
rather than the regular end-of-week update. Your feedback
will be appreciated.
These extracts from my daily trading diary are for educational purposes and should not be interpreted as investment advice. Full terms and conditions can be found at Terms of Use.
These extracts from my daily trading diary are for educational purposes and should not be interpreted as investment advice. Full terms and conditions can be found at Terms of Use.
The Big Picture
The Nasdaq completed a primary trend
reversal and may drag other markets lower. Exercise caution and
wait for the markets to absorb the impact. The FTSE and
ASX show signs of recovery, but again may be affected by the
weakening technology sector. The Nikkei has reversed to a
primary down-trend on fears that the BoJ may move away from its
zero interest rate policy.
The dollar is headed for a watershed in the next 12 to 18 months, threatening a head and shoulders reversal against the euro and displaying a large descending triangle against the yen. Present buoyant conditions in the US are supported by foreign central banks, with non-resident holdings of treasuries increasing from 4% to 12% of GDP over the last 20 years. The trend is unlikely to reverse in the near future, but it cannot continue indefinitely.
The Fed is unlikely to delay further rates increases unless there are clear signs that inflationary pressures have eased. They cannot afford to have their credentials as inflation hawks questioned.
Gold faces upward pressure from rising crude oil prices and inflation. A weakening dollar would add further pressure.
USA
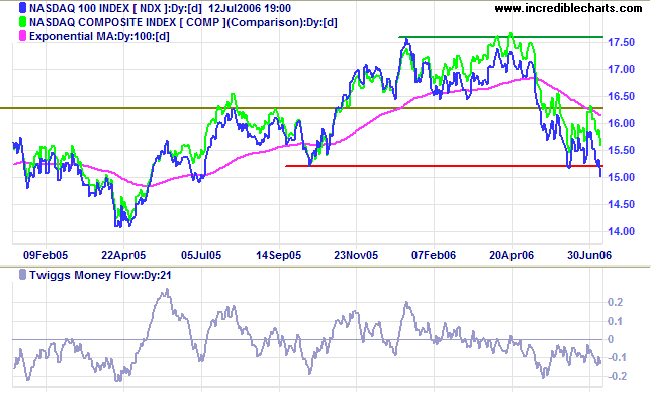
The Nasdaq 100 broke through primary support at 1520,
signaling a primary trend reversal.
Twiggs Money Flow (21-day) remains below zero, warning of
long-term
distribution. Though unlikely, reversal above 1520 would
complete a bear trap.
The Dow Industrial Average broke through
initial support at 11050/11000 and the 100-day
exponential moving average, dragged lower by the Nasdaq. Expect a test of support at 10900.
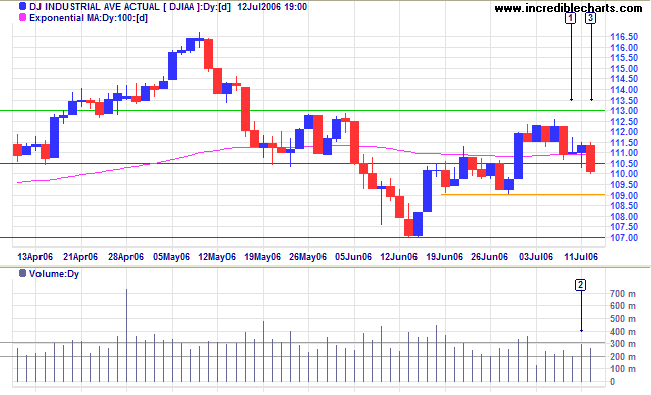
Medium Term: A close below 10900 would test primary
support at 10700, while reversal above 11300 would signal a
test of 11650.
Twiggs Money Flow (21-day) below the zero line, signals
distribution.
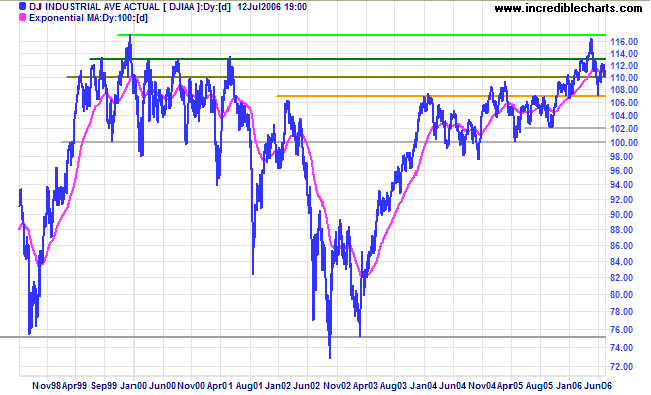
Long Term: The Dow is in a primary up-trend, but a fall below 10700 would mean a reversal.
Long Term: The Dow is in a primary up-trend, but a fall below 10700 would mean a reversal.
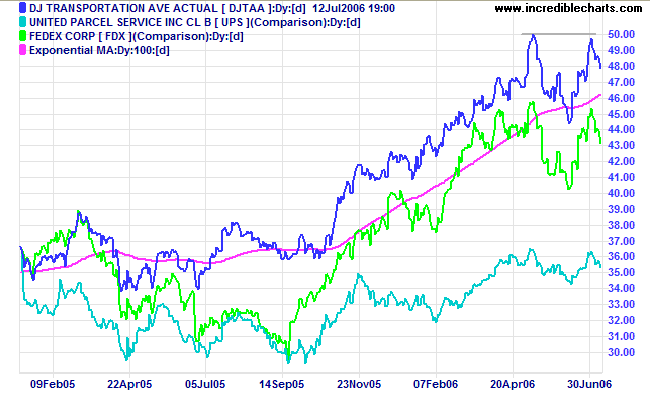
The Dow Jones Transportation Average and lead
indicators, Fedex and UPS, retreated from resistance at their
previous highs and now appear headed for a test of primary
support. There is not yet cause for concern: the index remains
in a primary up-trend.
The S&P 500 is testing
initial support at 1260.
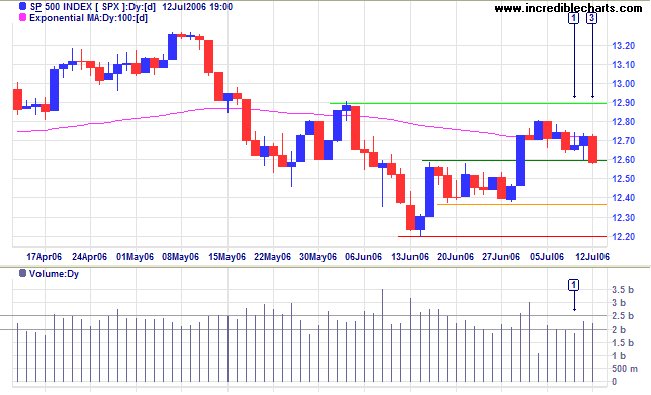
Medium Term: With the weak technology sector, support at
1260 is unlikely to hold and we may see a test of primary
support at 1220.
Twiggs Money Flow (21-day) below zero signals
distribution. Considering the circumstances, a rally above
1290 would be a strong bull signal.
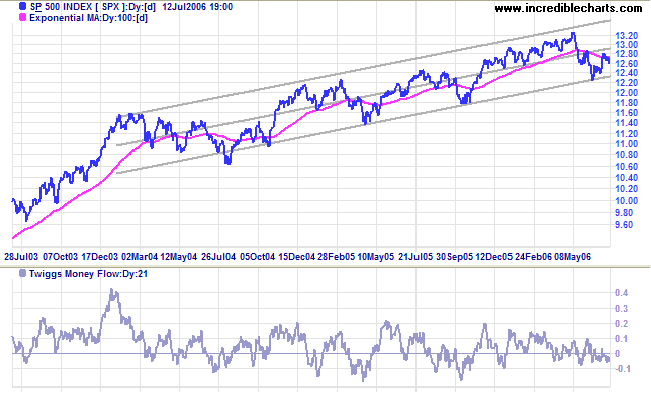
Long Term: The S&P 500 is in a slow up-trend, oscillating within a channel drawn at 2 standard deviations around a linear regression line. A break below the bottom channel would be a strong bear signal.
Long Term: The S&P 500 is in a slow up-trend, oscillating within a channel drawn at 2 standard deviations around a linear regression line. A break below the bottom channel would be a strong bear signal.
Treasury yields
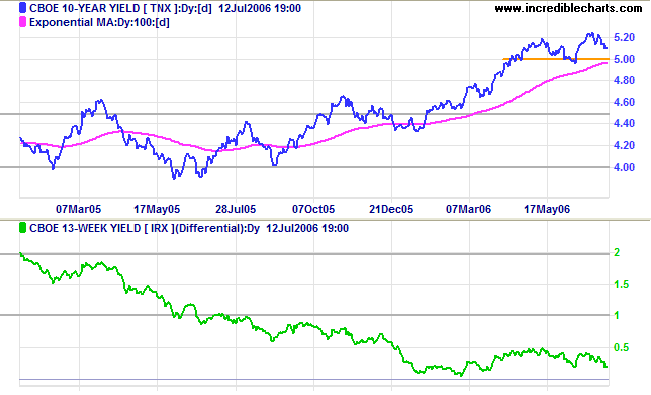
The yield on 10-year Treasury notes is headed for a test of support at 5.0%.
Medium Term: Long-bond yields are likely to respect their 100-day exponential moving average and continue in an up-trend.
Long Term: The yield differential (10-year T-notes minus 13-week T-bills) is falling, leaving the economy vulnerable if short-term rates continue to rise.
Wright Model
Developed by Fed economist Jonathan H Wright, the Wright Model combines the yield differential and fed funds rate to calculate the probability of recession. Looking ahead at the next four quarters, the probability remains a modest 24%.
Developed by Fed economist Jonathan H Wright, the Wright Model combines the yield differential and fed funds rate to calculate the probability of recession. Looking ahead at the next four quarters, the probability remains a modest 24%.
Gold
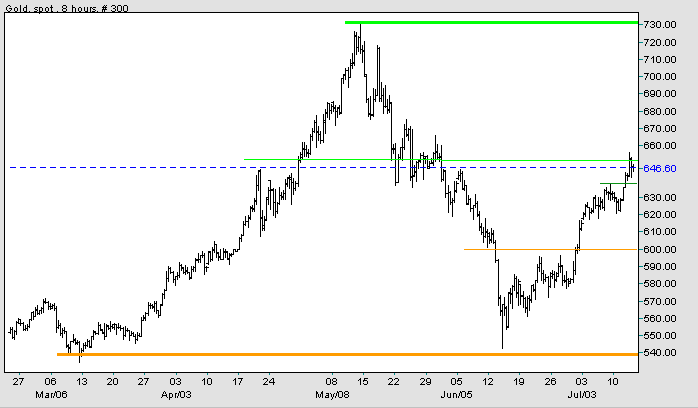
Spot gold is testing resistance at $650/ounce. If price holds above initial support at $640, that would be a bullish sign.
Medium Term: A breakout above $650 would signal a test of the previous high at $730, while correction below $650 would test support at $600.
Long Term: Gold continues in an up-trend, with primary support at $535/$540. The gold-oil ratio increased to 8.6 (up-turns below 10 normally signal buying opportunities, while down-turns above 20 indicate selling opportunities). High crude oil prices, inflation and a weakening dollar are bullish influences, while rising interest rates and a strengthening dollar would be bearish influences.
Source: Netdania
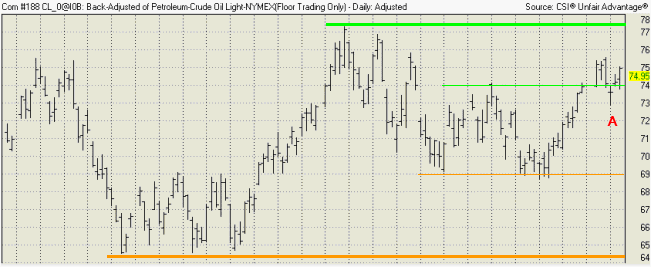
Crude Oil
Light Crude fell below support at $74/barrel at [A] before recovering to $74.95 on Wednesday. The false break is a bullish sign, warning that a test of the previous high at $77 may be imminent. Reversal below $74, on the other hand, would mean a test of support at $69; and a close below $69 would test primary support at $64/$65.
Light Crude fell below support at $74/barrel at [A] before recovering to $74.95 on Wednesday. The false break is a bullish sign, warning that a test of the previous high at $77 may be imminent. Reversal below $74, on the other hand, would mean a test of support at $69; and a close below $69 would test primary support at $64/$65.
Currencies
The dollar is weakening against major trading partners in the short-term, but in the long-term is approaching a major watershed.
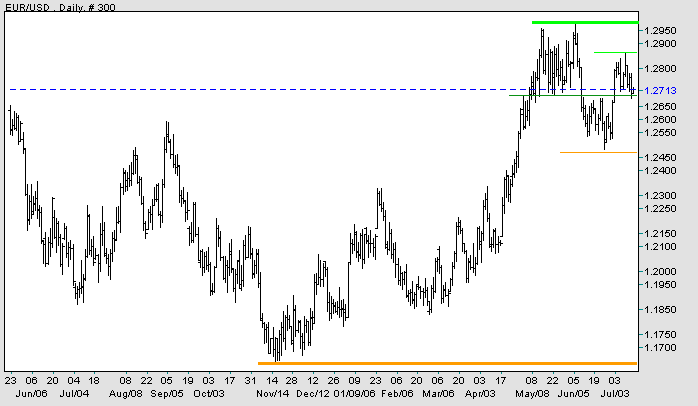
EUR/USD: The euro is testing initial support at 1.27 USD. If this holds, expect a test of the recent high at 1.285.
Long-term: A rise above 1.30 would test the previous all-time high of 1.37. A fall below 1.165, on the other hand, would complete a major head and shoulders reversal (with a target of 0.97: 1.17 - (1.37 - 1.17)).
The dollar is weakening against major trading partners in the short-term, but in the long-term is approaching a major watershed.
EUR/USD: The euro is testing initial support at 1.27 USD. If this holds, expect a test of the recent high at 1.285.
Long-term: A rise above 1.30 would test the previous all-time high of 1.37. A fall below 1.165, on the other hand, would complete a major head and shoulders reversal (with a target of 0.97: 1.17 - (1.37 - 1.17)).
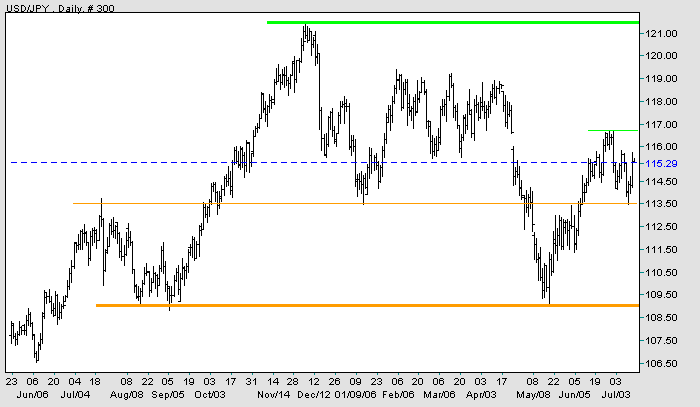
USD/JPY: The dollar appears headed for a test of short-term
support at 113.50. A break of this level would indicate a test
of major support at 109, while a rise above 117 would signal a
test of resistance at 121.50.
Long-term: A rise above the January 2006 high of 121.50 would break the bearish descending triangle started in 1998 and signal a primary up-trend. A fall below 100, however, would be a strong bear signal.
Long-term: A rise above the January 2006 high of 121.50 would break the bearish descending triangle started in 1998 and signal a primary up-trend. A fall below 100, however, would be a strong bear signal.
Source: Netdania
United Kingdom
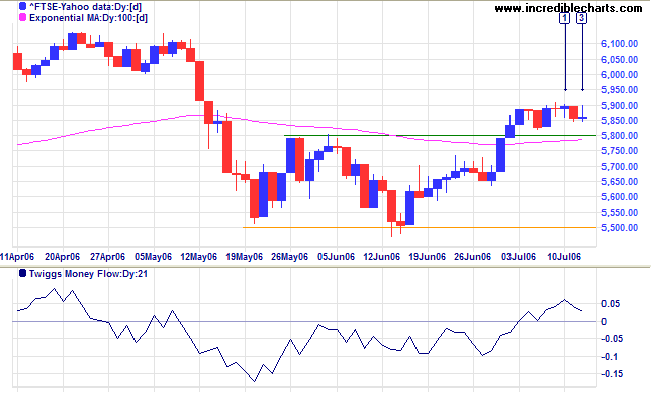
The FTSE 100 is consolidating in a narrow range between 5800 and 5900; a bullish continuation pattern.
Medium Term: Twiggs Money Flow (21-day) above zero, signals accumulation. A breakout above 5900 would signal a test of the previous high at 6130. Look for increased volume on the breakout. Taking the Nasdaq into account, a close below 5800 or the 100-day exponential moving average would warn of another test of primary support at 5500.
Long Term: The FTSE 100 is in a primary up-trend.
Japan
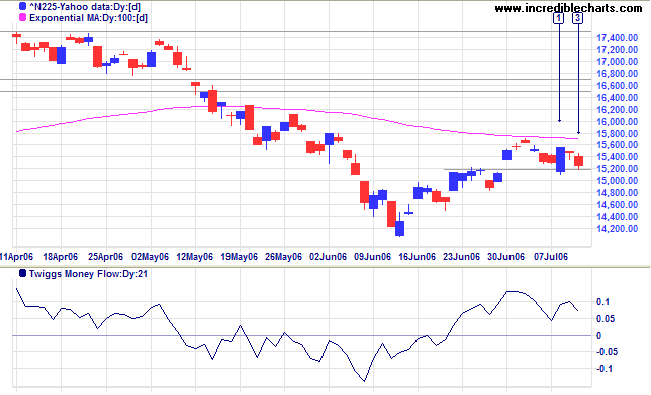
The Nikkei 225 made another attempt at resistance at 15500, but again retreated. A close below 15200 would be bearish.
Medium Term: If the index respects the 100-day exponential moving average from below, that would be a strong bear signal. Expect a test of support at 14000/14200. A close below this level would confirm the down-trend.
Long Term: The index is in a primary down-trend, with support at 14000, 13000 and major support at 12000.
ASX Australia
The All Ordinaries is consolidating in a narrow band around the former resistance level of 5080; a bullish continuation signal in an up-trend. A break above the high of [1] will signal a test of the previous high of 5350. Reversal below 5050, however, would be bearish, while a close below the 100-day exponential moving average would signal a test of primary support at 4800.
The All Ordinaries is consolidating in a narrow band around the former resistance level of 5080; a bullish continuation signal in an up-trend. A break above the high of [1] will signal a test of the previous high of 5350. Reversal below 5050, however, would be bearish, while a close below the 100-day exponential moving average would signal a test of primary support at 4800.
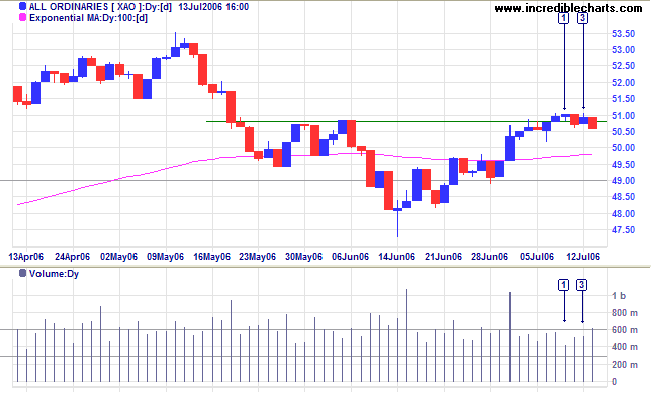
Medium Term: The index above the 100-day
exponential moving average and the (central) linear
regression line confirm the latest rally.
Twiggs Money Flow (21-day) trending upwards signals
accumulation. The index is headed for a test of the upper
channel line, but exercise caution as the Nasdaq may have a domino effect on other markets.
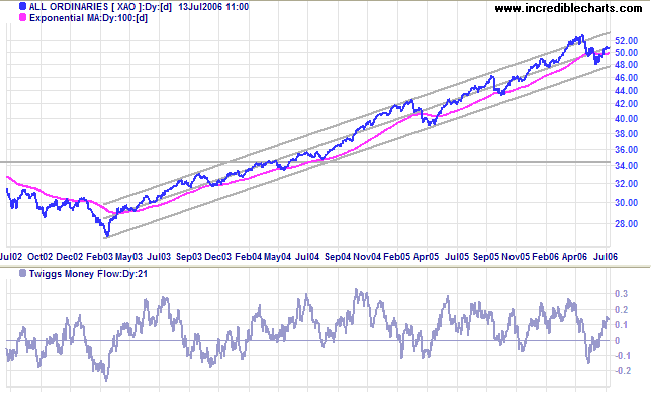
Long Term: The All Ordinaries is in a primary up-trend,
with primary support at 4800.
We cannot do great deeds unless we are
willing to do the small things that make up the sum of
greatness.
~ Theodore Roosevelt
~ Theodore Roosevelt
For more background information, read About
the Trading Diary.

Author: Colin Twiggs is a former investment banker with almost 40 years of experience in financial markets. He co-founded Incredible Charts and writes the popular Trading Diary and Patient Investor newsletters.
Using a top-down approach, Colin identifies key macro trends in the global economy before evaluating selected opportunities using a combination of fundamental and technical analysis.
Focusing on interest rates and financial market liquidity as primary drivers of the economic cycle, he warned of the 2008/2009 and 2020 bear markets well ahead of actual events.
He founded PVT Capital (AFSL No. 546090) in May 2023, which offers investment strategy and advice to wholesale clients.