These extracts from my daily trading diary are for educational
purposes and should not be interpreted as investment advice.
Full terms and conditions can be found at
Terms of Use.
The Big Picture
The Fed left its options open, but is unlikely to delay further
increases unless there are clear signs that inflationary
pressures have eased. At present there are conflicting signals,
with low new jobs figures for June signaling that the economy
may be slowing, but a 0.5% month-on-month gain in the average
hourly wage warns that inflation is far from
dormant.
The dollar is headed for a watershed in the next 12 to 18 months which will determine whether it continues to weaken against major trading partners or reverses the long-term trend. The present buoyant conditions are supported by foreign central banks: any move to diversify their reserve holdings into other currencies would place downward pressure on the currency and upward pressure on long-term interest rates. Though unlikely to happen in the near future, as this would amount to biting the hand that feeds them, the current trend cannot continue indefinitely.
Gold faces upward pressure from rising crude oil prices and inflation. If the dollar continues to weaken, the rally should continue.
Equity markets give mixed signals, with the Dow and S&P 500 showing early signs of recovery from the recent secondary correction and transport indicators signaling increased economic activity, but the Nasdaq displays long-term distribution and could drag other indexes lower. Exercise caution and wait for confirmation of the reversal. The FTSE and ASX also show signs of recovery, while the Nikkei has reversed to a primary down-trend in anticipation of the BoJ raising interest rates.
USA
The Dow Industrial Average is testing support at
11050/11000 and the 100-day
exponential moving average. The up-trend would be confirmed
if support holds and/or the index closes above 11300. Though
less likely, a fall below 10900 would test primary support at
10700.
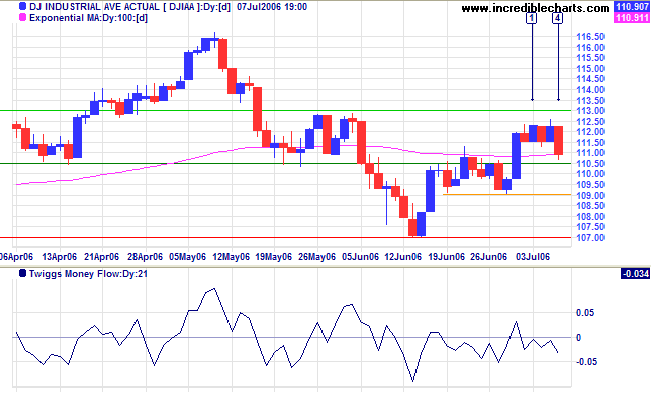
Medium Term: A close above 11300 would signal a rally to
test 11650, while a close below 10700 would mean a primary
trend reversal.
Twiggs Money Flow (21-day) continues to whipsaw around the
zero line, signaling uncertainty.
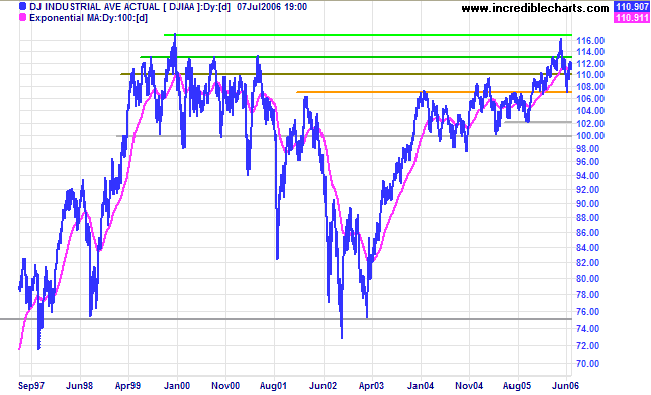
Long Term: The Dow is in a reasonable primary up-trend.
Long Term: The Dow is in a reasonable primary up-trend.
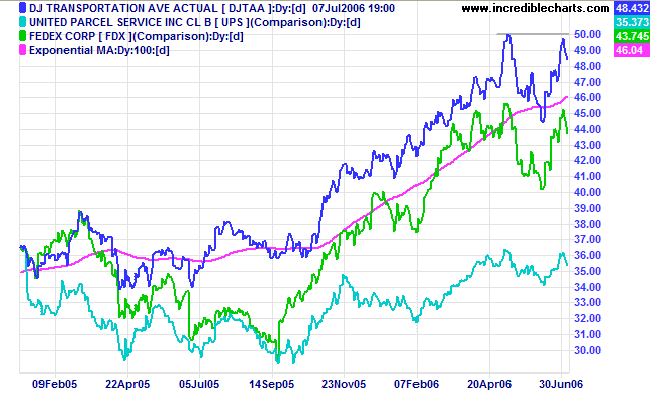
The Dow Jones Transportation Average has so far
respected resistance at the previous high of 5000. Lead
indicators, Fedex and UPS, have done likewise. The primary
up-trends signal increasing economic activity and confirm a
bull market.
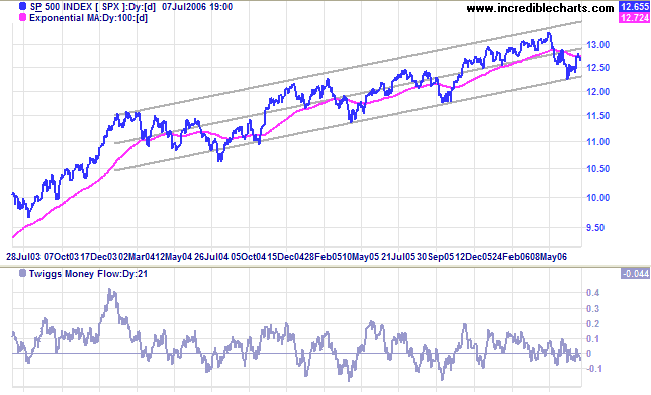
The S&P 500 is retracing to test the new support
level at 1260.
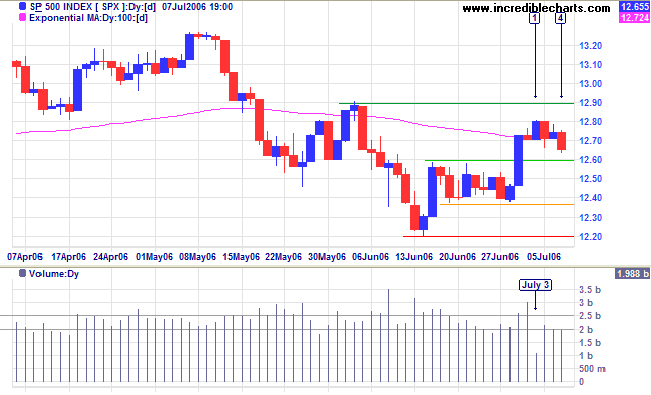
Medium Term: If the retracement respects support at
1260, that would confirm the latest rally, with a likely test
of the previous high at 1325. A close above 1290 would add
further confirmation. Failure of the new support level,
however, would signal trend weakness and a possible test of
primary support at 1220.
Twiggs Money Flow (21-day) whipsawing around the zero line
signals uncertainty.
Long Term: The S&P 500 is in a slow up-trend, oscillating within a channel drawn at 2 standard deviations around a linear regression line.
Long Term: The S&P 500 is in a slow up-trend, oscillating within a channel drawn at 2 standard deviations around a linear regression line.
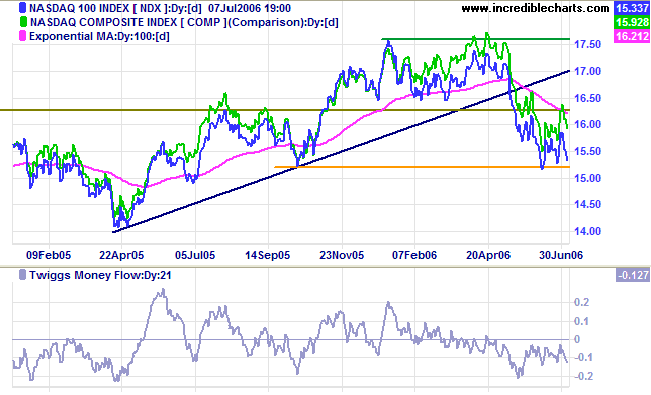
The Nasdaq 100 is headed for another test of primary
support at 1520.
Twiggs Money Flow (21-day) remains below zero, warning of
long-term
distribution. This is cause for concern: a close below 1520
would signal a primary trend reversal and may drag the Dow and
S&P 500 lower. Though less likely, a close above 1630 would
relieve the downward pressure.
Treasury yields
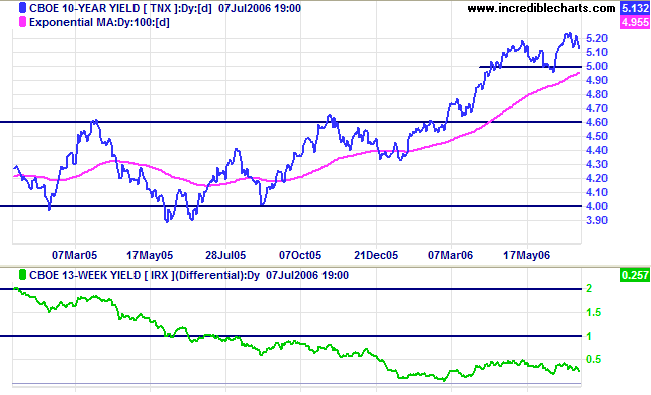
The yield on 10-year Treasury notes is retracing to test support at 5.0%.
Medium Term: Long-bond yields are likely to respect their 100-day exponential moving average and continue in an up-trend.
Long Term: The yield differential (10-year T-notes minus 13-week T-bills) is low, leaving the economy vulnerable if short-term interest rates continue to rise.
Wright Model
Developed by Fed economist Jonathan H Wright, the Wright Model combines the yield differential and fed funds rate to calculate the probability of recession. Looking ahead at the next four quarters, the probability ticked up slightly, but remains a modest 24%.
Developed by Fed economist Jonathan H Wright, the Wright Model combines the yield differential and fed funds rate to calculate the probability of recession. Looking ahead at the next four quarters, the probability ticked up slightly, but remains a modest 24%.
Gold
Spot gold formed an ascending flag over the past week, normally a continuation signal in an up-trend.
Medium Term: Expect some resistance at $650, while a retracement would test the new support level at $600.
Long Term: Gold continues in a primary up-trend, with support at $535/$540. The gold-oil ratio increased to 8.5. An up-turn below 10 would normally signal buying opportunities, while a down-turn above 20 would indicate selling opportunities. High crude oil prices, inflation and a weakening dollar are bullish influences on the gold price, whereas rising interest rates and a strengthening dollar would be bearish influences.
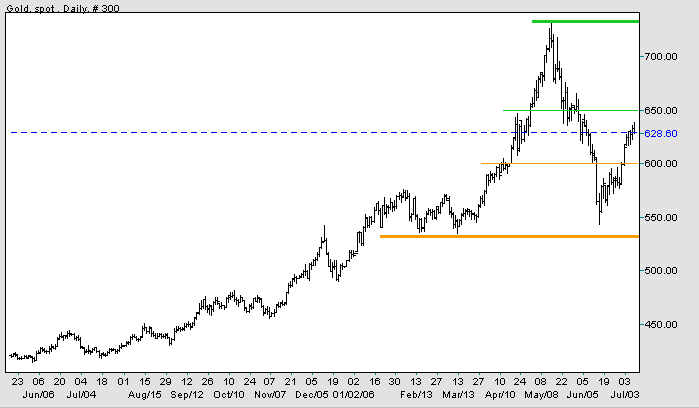
Source: Netdania
Crude Oil
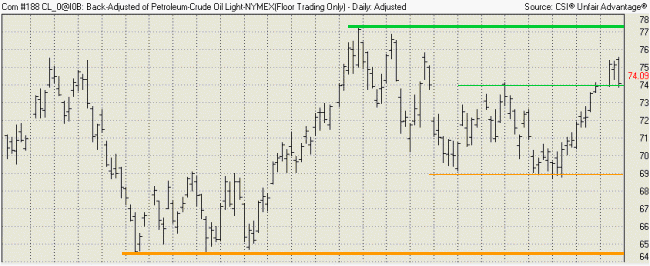
Light Crude broke through medium-term resistance at $74/barrel, completing a bullish double bottom and signaling a test of the previous high at $77. Narrow consolidation above $74 is a bullish sign. Though less likely, a reversal below $74 would signal a test of support at $69; while a close below $69 would mean a test of primary support at $64/$65.
Light Crude broke through medium-term resistance at $74/barrel, completing a bullish double bottom and signaling a test of the previous high at $77. Narrow consolidation above $74 is a bullish sign. Though less likely, a reversal below $74 would signal a test of support at $69; while a close below $69 would mean a test of primary support at $64/$65.
Currencies
The dollar is weakening against major trading partners in the short-term, but in the long-term may be approaching a major turning point.
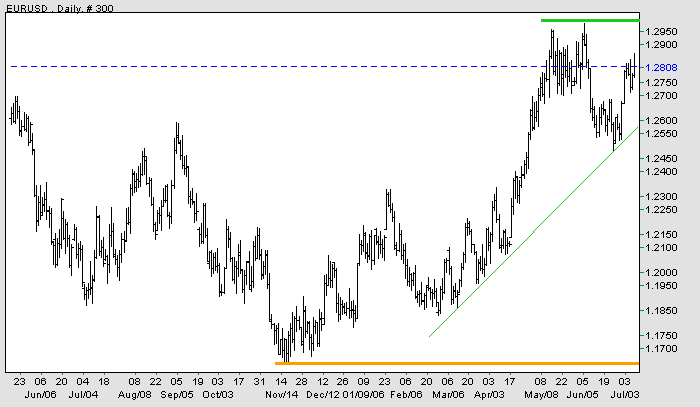
EUR/USD: The euro continues its recent rally against the dollar and appears headed for a test of resistance at 1.30.
Long-term: A fall below 1.165 would complete a major head and shoulders reversal (with a target of 0.97: 1.17 - (1.37 - 1.17)). A rise above 1.30, on the other hand, would test the previous high of 1.37.
The dollar is weakening against major trading partners in the short-term, but in the long-term may be approaching a major turning point.
EUR/USD: The euro continues its recent rally against the dollar and appears headed for a test of resistance at 1.30.
Long-term: A fall below 1.165 would complete a major head and shoulders reversal (with a target of 0.97: 1.17 - (1.37 - 1.17)). A rise above 1.30, on the other hand, would test the previous high of 1.37.
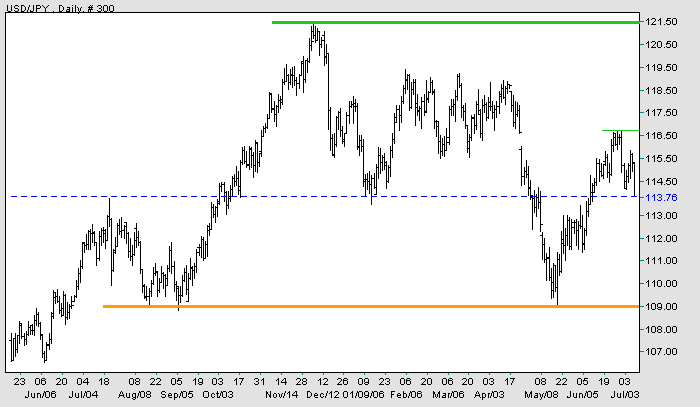
USD/JPY: The dollar continues to weaken against the yen and
appears headed for a test of medium-term support at
109.
Long-term: A rise above the January 2006 high of 121.50 would break the bearish descending triangle started in 1998 and signal a primary up-trend. A fall below 100, on the other hand, would be a strong bear signal.
Long-term: A rise above the January 2006 high of 121.50 would break the bearish descending triangle started in 1998 and signal a primary up-trend. A fall below 100, on the other hand, would be a strong bear signal.
Source: Netdania
United Kingdom
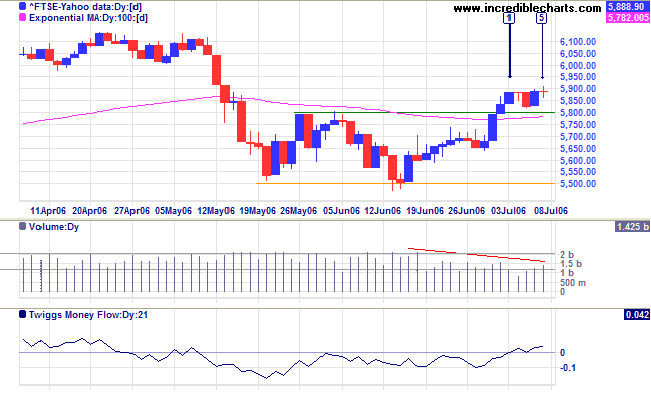
After completing a bullish double bottom, the FTSE 100 consolidated in a narrow range above the new support level. Generally a continuation pattern, the consolidation signals that a test of the previous high at 6130 is likely.
Medium Term: Declining volume on the latest rally signals weakness, though the last week was affected by the July 4th holiday in the US. Twiggs Money Flow (21-day) climbed above zero, signaling accumulation. A close above 5900 would add further confirmation, as would a pull-back that respects support (or the 100-day exponential moving average) at 5800. Though less likely, a close below 5800 would signal a test of primary support at 5500.
Long Term: The FTSE 100 continues in a primary up-trend.
Japan
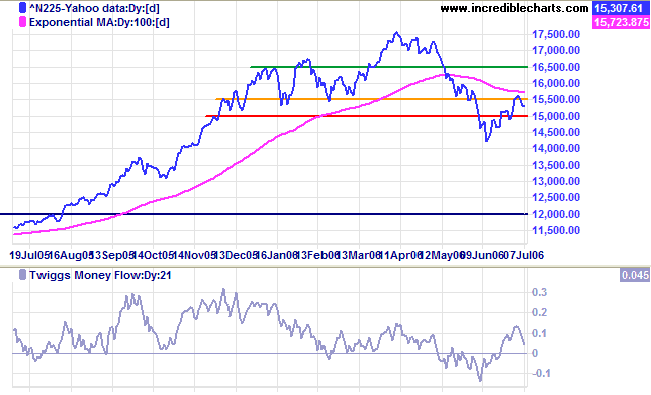
The Nikkei 225 completed a false break, retreating below 15500 after two days.
Medium Term: The latest retracement is a strong bear signal, with the index respecting both resistance at 15500 and the 100-day exponential moving average from below. A close below 15000 would confirm the down-trend.
Long Term: The index is in a primary down-trend. Support levels are at 14000 and 13000, with major support at 12000.
ASX Australia
The All Ordinaries took several days to overcome resistance at 5080, but Friday's breakout confirms the end of the secondary correction. Expect a test of the previous high at 5350. Reversal below the new support level, however, would signal a test of primary support at 4800.
The All Ordinaries took several days to overcome resistance at 5080, but Friday's breakout confirms the end of the secondary correction. Expect a test of the previous high at 5350. Reversal below the new support level, however, would signal a test of primary support at 4800.
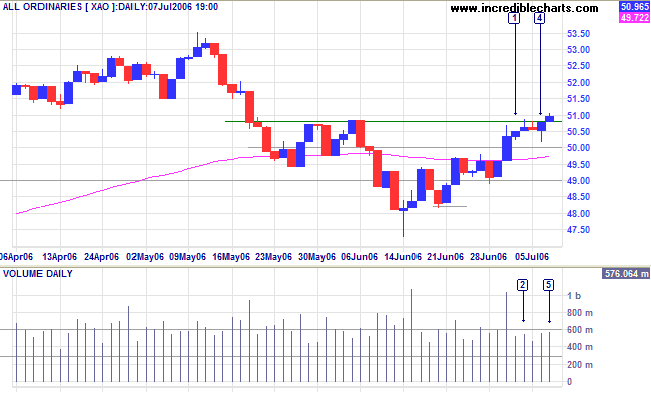
Medium Term: The index is above the 100-day
exponential moving average and the (central) linear
regression line, confirming the reversal.
Twiggs Money Flow (21-day) trending upwards signals
accumulation. Expect a test of the upper channel line.
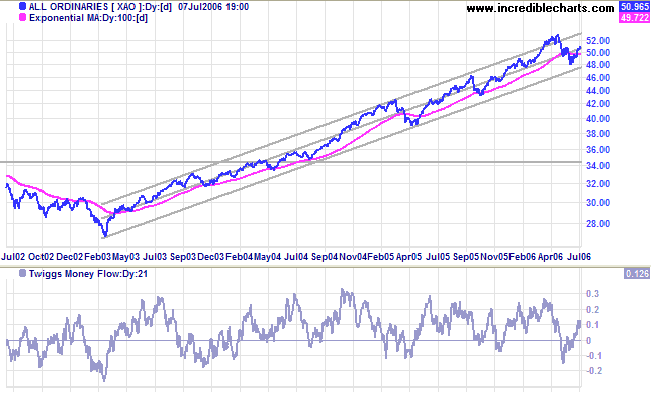
Long Term: The All Ordinaries continues in a primary
up-trend, with primary support at 4800.
In this game, the market has to keep
pitching, but you don't have to swing.
You can stand there with the bat on your shoulder for six months until you get a fat pitch.
~ Warren Buffett
You can stand there with the bat on your shoulder for six months until you get a fat pitch.
~ Warren Buffett
For more background information, read About
the Trading Diary.

Author: Colin Twiggs is a former investment banker with almost 40 years of experience in financial markets. He co-founded Incredible Charts and writes the popular Trading Diary and Patient Investor newsletters.
Using a top-down approach, Colin identifies key macro trends in the global economy before evaluating selected opportunities using a combination of fundamental and technical analysis.
Focusing on interest rates and financial market liquidity as primary drivers of the economic cycle, he warned of the 2008/2009 and 2020 bear markets well ahead of actual events.
He founded PVT Capital (AFSL No. 546090) in May 2023, which offers investment strategy and advice to wholesale clients.