Trading Diary
July 01, 2006
These extracts from my daily trading diary are for educational
purposes and should not be interpreted as investment advice. Full
terms and conditions can be found at Terms
of Use.
USA
The Big Picture: There are two events that would convince
me that the Fed is not going to continue raising interest rates:
(1) the chairman makes a clear statement ("read my lips") that
there will be no further rates increases; or (2) the Fed lowers
the interest rate. Until then we are all chasing shadows. In
fact, either of these actions would be a bear signal, prompted by
slowing economic growth. High energy prices are likely to
maintain inflationary pressures, forcing further rates hikes,
though not necessarily at every meeting.
The dollar is approaching a watershed in the next 12 to 18 months which should determine whether it will continue to weaken against major trading partners or reverse the long-term trend. Bear in mind that the economy is supported by foreign central banks and any move to diversify their reserve holdings into other currencies would place downward pressure on the currency and upward pressure on long-term interest rates.
Gold faces upward pressure from rising crude oil prices and inflation. If the dollar continues to weaken, expect a strong rally.
Equity markets show early signs of recovery from the recent secondary correction. Exercise caution and wait for confirmation of the reversal. In the longer term, keep a weather eye on the dollar and long-term interest rates.
The Dow Industrial Average broke above its 100-day
exponential moving average on strong volume at [4]. However a
narrow range and even bigger volume at [5] urge caution. The
up-trend would be confirmed if a retracement respects support at
11050 or the index closes above 11300. Though less likely, a fall
below 10900 would be bearish.
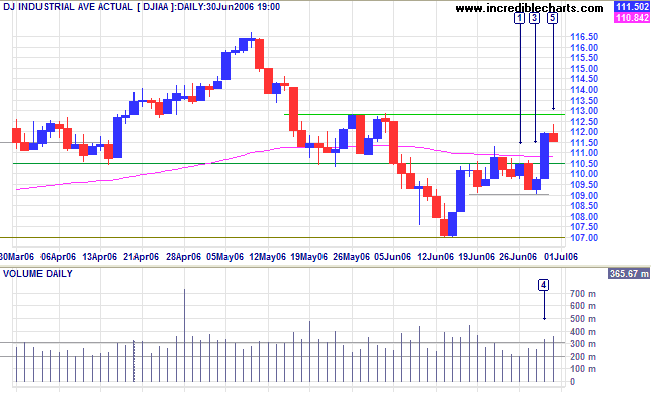
Medium Term: A close above 11300 would signal another test
of 11650, while a close below 10700 would mean a test of primary
support at 10000/10200.
Twiggs Money Flow (21-day) continues to whipsaw around the
zero line, indicating uncertainty.
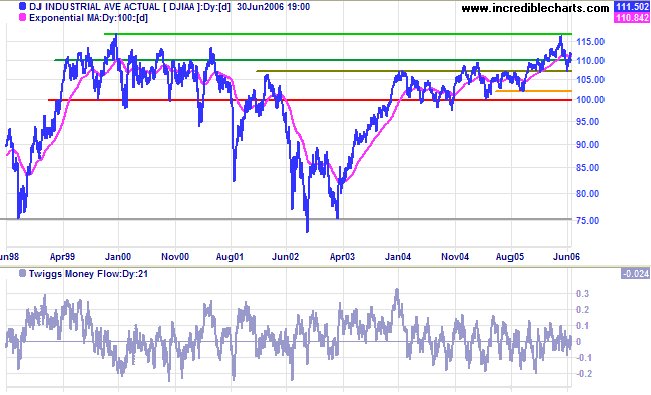
Long Term: Respect of support at 10700 signals that the index is likely to continue its up-trend. A reversal below 10700, on the other hand, would warn of a stage 3 top.
Long Term: Respect of support at 10700 signals that the index is likely to continue its up-trend. A reversal below 10700, on the other hand, would warn of a stage 3 top.
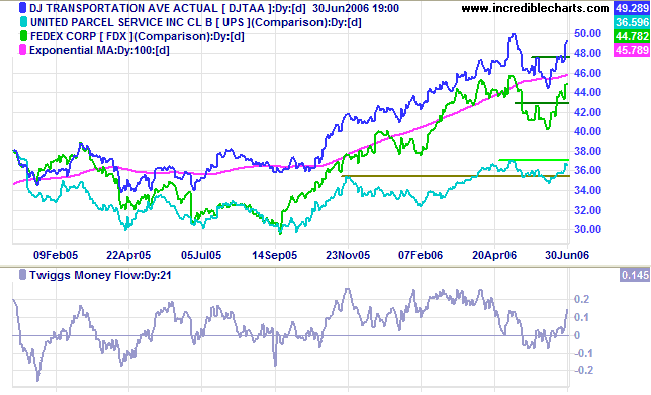
The Dow Jones Transportation Average and lead indicators,
Fedex and UPS, all show signs that the secondary correction is
over. Their primary up-trends confirm a bull market.
The S&P 500 broke through resistance at 1260 with a
strong blue candle at [4], but big volume and a narrow range at
[5] warn of further resistance.
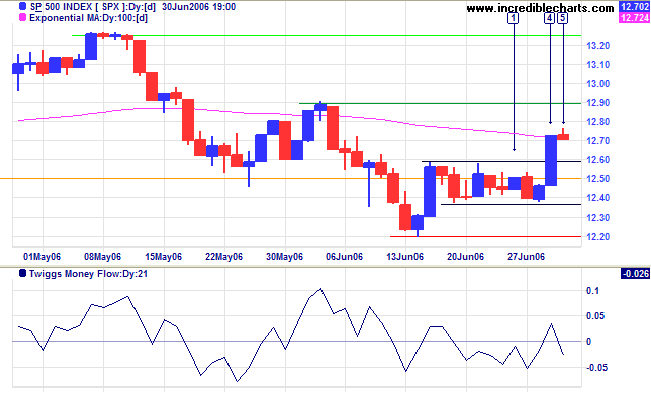
Medium Term: A retracement that respects support at 1260
would confirm the latest rally, as would a close above 1290, but
failure of the support level would indicate another test of
support at 1220.
Twiggs Money Flow (21-day) whipsawing around the zero line
warns of continued uncertainty.
Long Term: The S&P 500 is in a slow up-trend, with primary support at 1180.
Long Term: The S&P 500 is in a slow up-trend, with primary support at 1180.
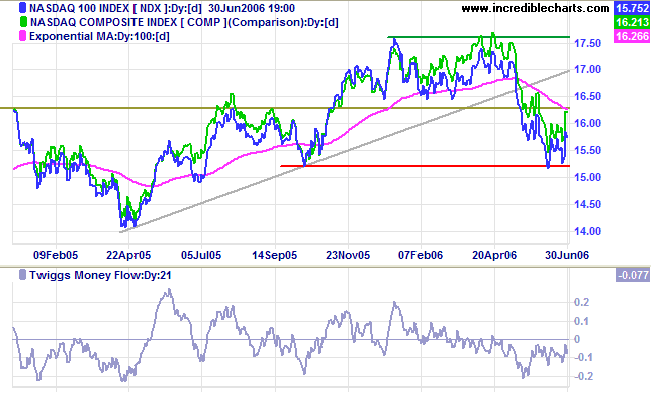
The Nasdaq 100 rallied slightly, but
Twiggs Money Flow (21-day) remains below zero, warning of
long-term
distribution. Expect another test of support at 1520. A close
below this level would mean a primary trend reversal, with
bearish implications for the Dow and S&P 500. A close above
1630, on the other hand, would signal a test of the previous high
at 1760.
Treasury yields
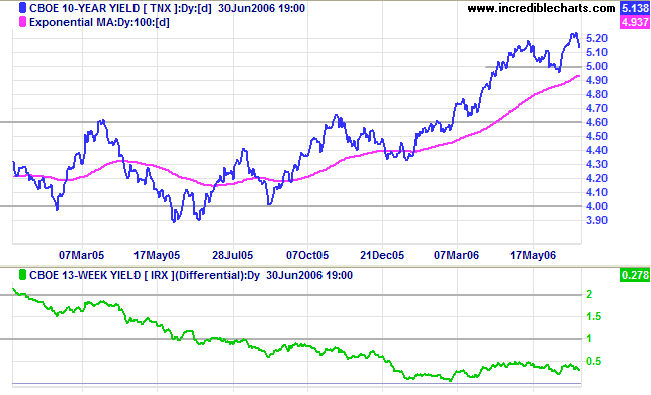
The Fed hiked rates by another 0.25% at its June meeting. Expect further rates hikes unless inflation fears dissipate.
Medium Term: The 10-year yield is retracing to test support at 5.0%. It is likely to respect its 100-day exponential moving average and continue the up-trend.
Long Term: The yield differential (10-year T-notes minus 13-week T-bills) is low, leaving the economy vulnerable if short-term interest rates continue to rise.
Wright Model
Developed by Fed economist Jonathan H Wright, the Wright Model combines the yield differential and fed funds rate to calculate the probability of recession. Looking ahead at the next four quarters, the probability remains a modest 23%.
Developed by Fed economist Jonathan H Wright, the Wright Model combines the yield differential and fed funds rate to calculate the probability of recession. Looking ahead at the next four quarters, the probability remains a modest 23%.
Gold
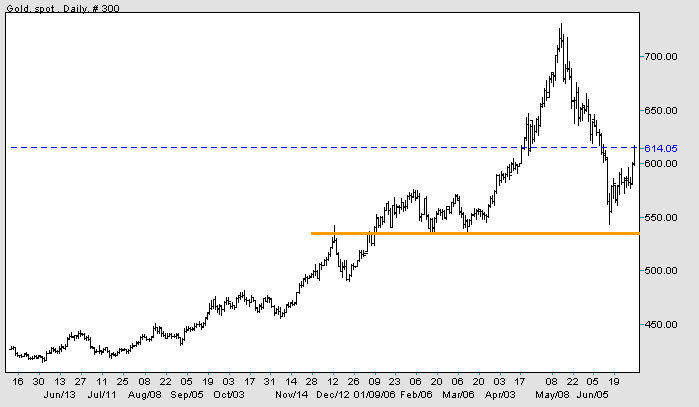
Spot gold broke through $600 on the back of dollar weakness.
Medium Term: Expect a retracement to test the new support level at $600. Failure of support would mean another test of primary support at $535/$540, while a successful test would signal further gains.
Long Term: The gold-oil ratio is at 8.3. An up-turn below 10 normally signals buying opportunities; down-turns above 20 indicate selling opportunities. High crude oil prices, inflation and a weakening dollar are bullish influences on the gold price, whereas rising interest rates and a strengthening dollar would be bearish influences.
Source: Netdania
Crude Oil
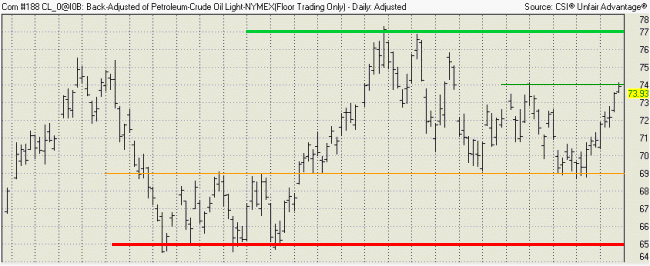
Light Crude is testing medium-term resistance at $74/barrel. A rise above this level would complete a bullish double bottom pattern, signaling a test of the previous high at $77. Though less likely, reversal below $69 would mean a test of primary support at $64/$65.
Light Crude is testing medium-term resistance at $74/barrel. A rise above this level would complete a bullish double bottom pattern, signaling a test of the previous high at $77. Though less likely, reversal below $69 would mean a test of primary support at $64/$65.
Currencies
The dollar is weakening against major trading partners in the short-term, but in the long-term may be approaching a major turning point.
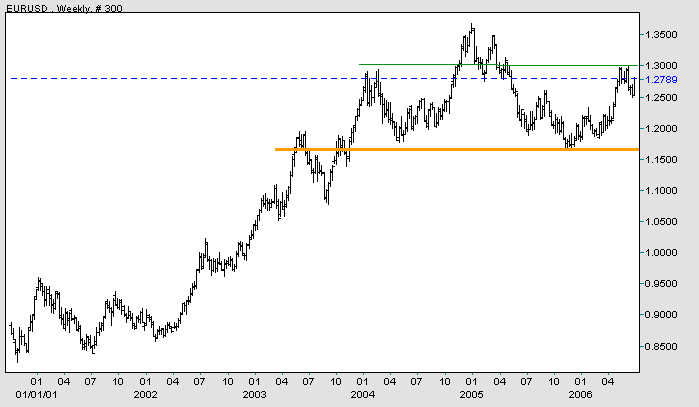
EUR/USD: The euro reversed direction in the last two days and appears headed for a test of resistance at 1.30.
In the long-term, a fall below 1.17 would complete a major head and shoulders reversal (with a target of 0.97: 1.17 - (1.37 - 1.17)). A reversal above 1.30, on the other hand, would test the previous high of 1.37.
The dollar is weakening against major trading partners in the short-term, but in the long-term may be approaching a major turning point.
EUR/USD: The euro reversed direction in the last two days and appears headed for a test of resistance at 1.30.
In the long-term, a fall below 1.17 would complete a major head and shoulders reversal (with a target of 0.97: 1.17 - (1.37 - 1.17)). A reversal above 1.30, on the other hand, would test the previous high of 1.37.
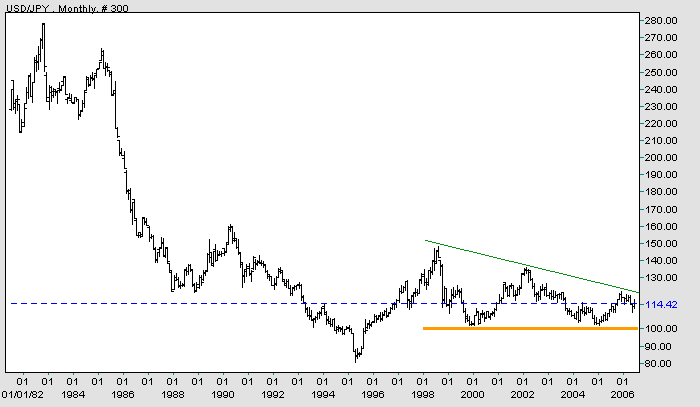
USD/JPY: The dollar weakened to 114.42 yen/dollar, headed for a
test of medium-term support at 109.
In the long-term, a rise above the January 2006 high of 121 would break the bearish descending triangle started in 1998 and signal a primary up-trend. A fall below 100, on the other hand, would be a strong bear signal.
In the long-term, a rise above the January 2006 high of 121 would break the bearish descending triangle started in 1998 and signal a primary up-trend. A fall below 100, on the other hand, would be a strong bear signal.
Source: Netdania
United Kingdom
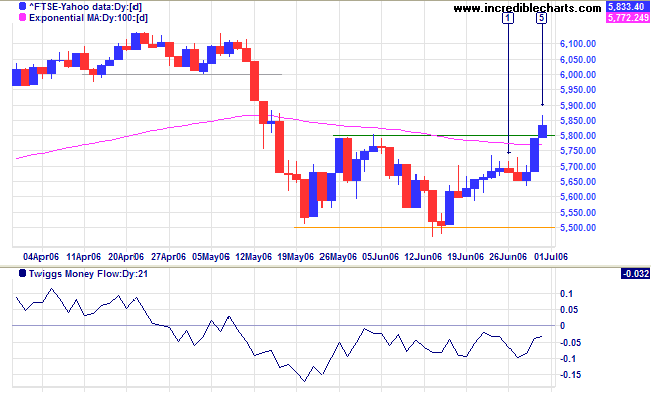
The FTSE 100 closed above 5800, completing a bullish double bottom.
Medium Term: Twiggs Money Flow (21-day) remains below zero because of the weak close at [5], warning of continued resistance. Caution dictates that we wait for a rise above the high of [5] (short-term) or a pull-back that respects support at 5800 (or the 100-day exponential moving average). A fall below the support level would be a bearish sign.
Long Term: The FTSE 100 remains in a primary up-trend.
Japan
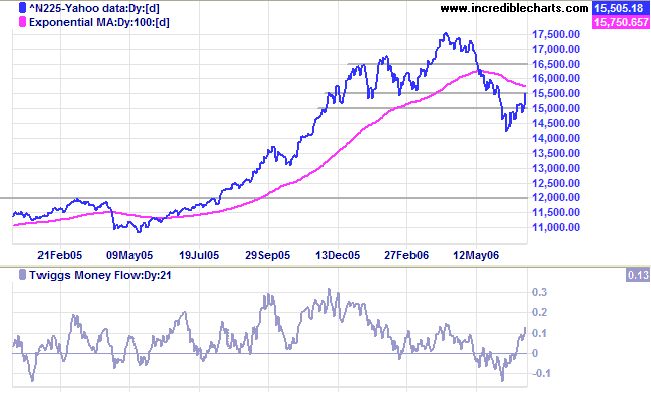
The Nikkei 225 pulled back to test resistance at 15500.
Medium Term: Twiggs Money Flow (21-day) is rising fast, reflecting accumulation in the medium-term, but the primary down-trend will be confirmed if the index respects 15500 or the 100-day exponential moving average, from below. A break above these levels, on the other hand, would mean continued uncertainty until a retracement confirms the new support level.
Long Term: The index is in a primary down-trend, with the next level of support at 13000 and major support at 12000.
ASX Australia
The All Ordinaries broke below the small rising wedge at [3], but reversed into a bear trap, with strong gains at [4] and [5]. However, the weak close and strong volume at [5] signal continued resistance and we should wait for a rise above the previous high of 5080 to confirm the breakout.
The All Ordinaries broke below the small rising wedge at [3], but reversed into a bear trap, with strong gains at [4] and [5]. However, the weak close and strong volume at [5] signal continued resistance and we should wait for a rise above the previous high of 5080 to confirm the breakout.
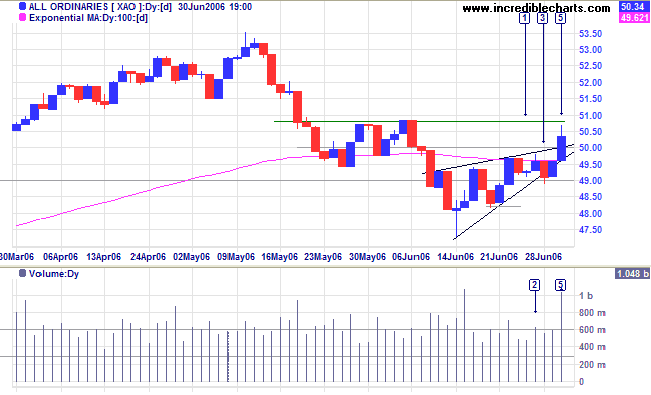
Medium Term: The index crossed to above its 100-day
exponential moving average. Be careful of whipsaws and wait
for a rise above the (central) linear regression line and the
recent high of 5080 to confirm the reversal.
Twiggs Money Flow (21-day) is trending upwards in the
short-term, signaling
accumulation.
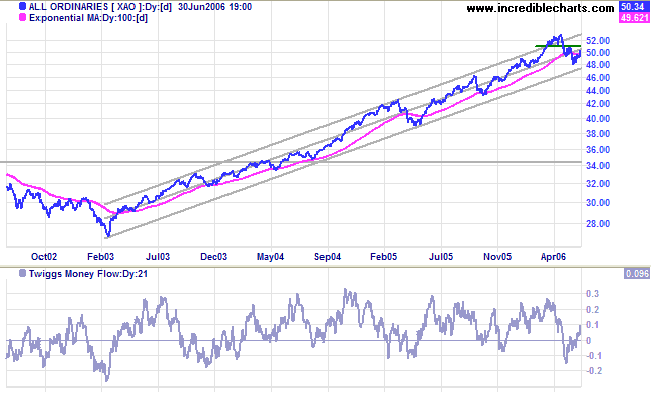
Long Term: The All Ordinaries continues in a primary
up-trend. Increasing volatility raises the likelihood of a
stage
3 top.
For further background information, read About
the Trading Diary.
Regards,
Regards,
Colin Twiggs
It isn't as important to buy as cheap as
possible as it is to buy at the right time.
~ Jesse Livermore
~ Jesse Livermore

Author: Colin Twiggs is a former investment banker with almost 40 years of experience in financial markets. He co-founded Incredible Charts and writes the popular Trading Diary and Patient Investor newsletters.
Using a top-down approach, Colin identifies key macro trends in the global economy before evaluating selected opportunities using a combination of fundamental and technical analysis.
Focusing on interest rates and financial market liquidity as primary drivers of the economic cycle, he warned of the 2008/2009 and 2020 bear markets well ahead of actual events.
He founded PVT Capital (AFSL No. 546090) in May 2023, which offers investment strategy and advice to wholesale clients.