Trading Diary
June 24, 2006
These extracts from my daily trading diary are for educational
purposes and should not be interpreted as investment advice. Full
terms and conditions can be found at Terms
of Use.
USA
The Big Picture: The NASDAQ is the
weakest of the three major indexes and we should watch for signs
of a primary trend reversal: failure of one index could drag the
others down. Transport indicators, on the
other hand, are recovering; so we should not be too hasty in
marking the demise of the bull market.
The dollar is strengthening (in the medium term) as interest rates rises appear inevitable. Higher rates will slow the property market and retail sales to a lesser degree, while a strong dollar could dampen export sales.
Crude oil respecting support at $69/barrel is bullish for gold, while a stronger dollar has a bearish effect. Whether primary support at $535 will hold depends on which of these factors exerts the most influence.
The Dow Industrial Average is consolidating in a narrow
band under resistance at 11050. Large volumes at [1] and [3]
indicate selling strength (note the tall shadow at [3]). A close
below 10950 would signal another test of support at 10700, while
a close above 11100 would signal a test of 11300 and the likely
end of the secondary correction.
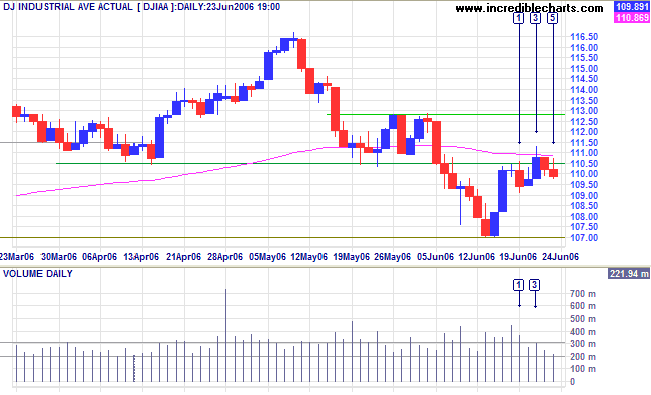
Medium Term: The Dow remains below its 100-day
exponential moving average and in a secondary correction. A
rise above 11300 would signal resumption of the up-trend and a
likely test of 11650, while a close below 10700 would signal a
test of primary support at 10000/10200.
Twiggs Money Flow (21-day) continues to whipsaw around the
zero line, indicating uncertainty.
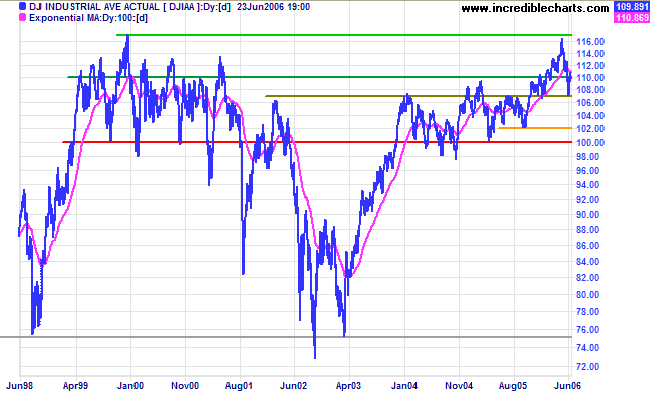
Long Term: Both the Dow Industrial and Transport Averages are in primary up-trends, confirming a bull market despite current turbulence. If the Industrial Average respects support at 10700, that would confirm the up-trend is likely to continue. A close below 10700, on the other hand, would warn that the index may be entering a stage 3 top.
Long Term: Both the Dow Industrial and Transport Averages are in primary up-trends, confirming a bull market despite current turbulence. If the Industrial Average respects support at 10700, that would confirm the up-trend is likely to continue. A close below 10700, on the other hand, would warn that the index may be entering a stage 3 top.
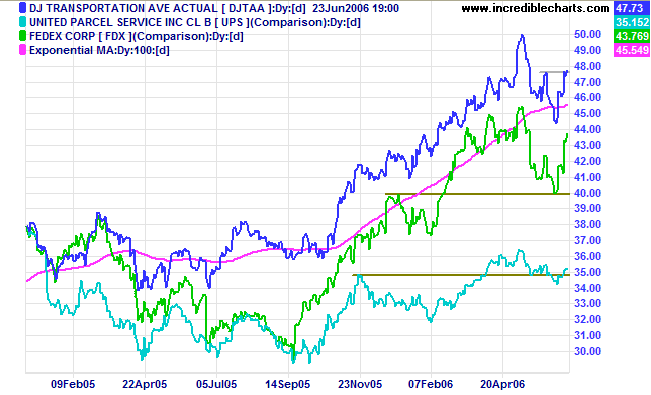
The Dow Jones Transportation Average respected its 100-day
exponential moving average. A close above 4800 would signal
that an attempt at 5000 is on the cards. Lead indicators, Fedex
and UPS, also show bullish signs, with Fedex respecting support
from the previous high. All are in primary up-trends.
The S&P 500 formed a small bearish
pennant below resistance at 1260.
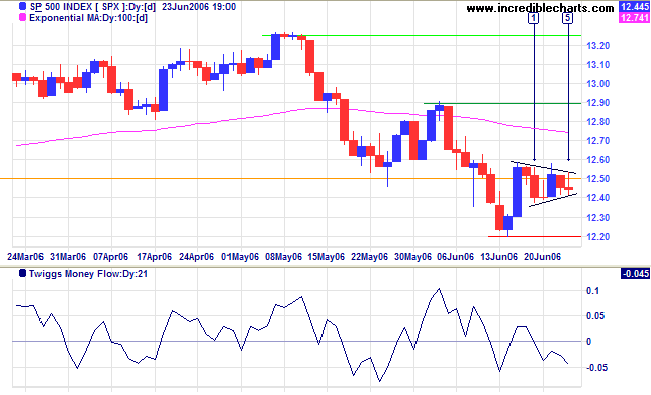
Medium Term: A fall below 1220 would signal a test of
primary support at 1180. A rise above 1260, on the other hand,
would signal a test of 1290 and a possible end to the secondary
correction.
Twiggs Money Flow (21-day) whipsawing around the zero line
indicates uncertainty.
Long Term: The S&P 500 is in a slow up-trend. A close below 1180 would signal a reversal.
Long Term: The S&P 500 is in a slow up-trend. A close below 1180 would signal a reversal.
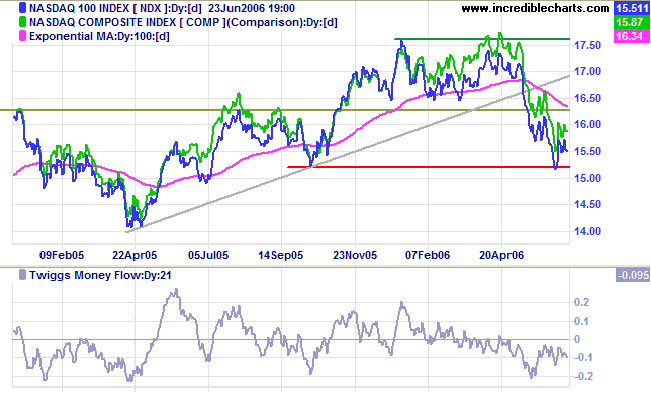
The Nasdaq 100 is holding above primary support at 1520,
but
Twiggs Money Flow (21-day) remains below zero, warning of
long-term
distribution. Expect another test of the support level. A
close below 1520 would mean a primary trend reversal, with
bearish implications for the Dow and S&P 500. A close above
1630, on the other hand, would signal a test of the previous high
at 1760.
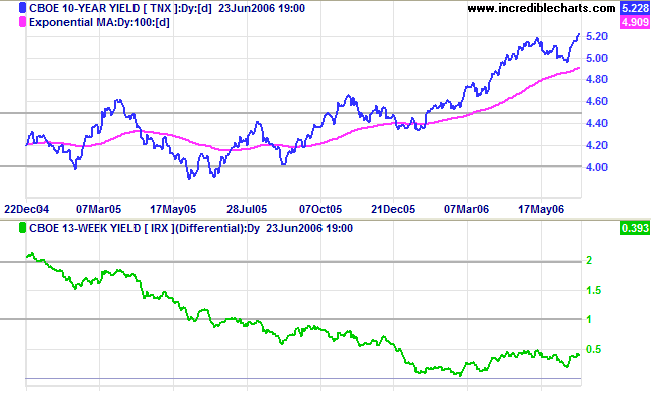
Treasury yields
Expect another 0.25% rate rise at the Fed's June 28-29 meeting: the new Chairman needs to establish his credentials as an inflation hawk. Thereafter, rate hikes may slow if inflation remains muted.
Medium Term: The 10-year yield respected its 100-day exponential moving average and is rising strongly.
Long Term: The yield differential (10-year T-notes minus 13-week T-bills) recovered slightly, but remains low, leaving the economy vulnerable if short-term interest rates continue to rise.
Wright Model
Developed by Fed economist Jonathan H Wright, the Wright Model combines the yield differential and fed funds rate to calculate the probability of recession. Looking ahead at the next four quarters, the probability remains at a modest 23%.
Developed by Fed economist Jonathan H Wright, the Wright Model combines the yield differential and fed funds rate to calculate the probability of recession. Looking ahead at the next four quarters, the probability remains at a modest 23%.
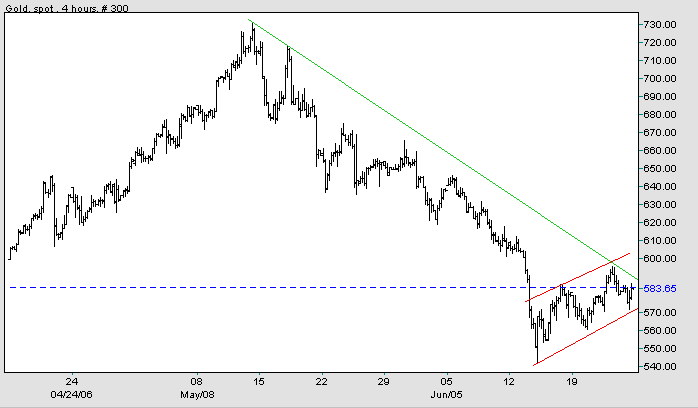
Gold
Spot gold formed a small flag below resistance at $600, signaling continuation of the down-trend.
Medium Term: Expect another test of primary support at $535/$540 if the index fails to break above $600 in the next few days. A stronger dollar will mean that gold is likely to weaken; and vice versa.
Long Term: The gold-oil ratio is below 9. Up-turns below 10 signal buying opportunities; down-turns above 20 indicate selling opportunities. Expect a recovery if crude prices remain high.
Source: Netdania
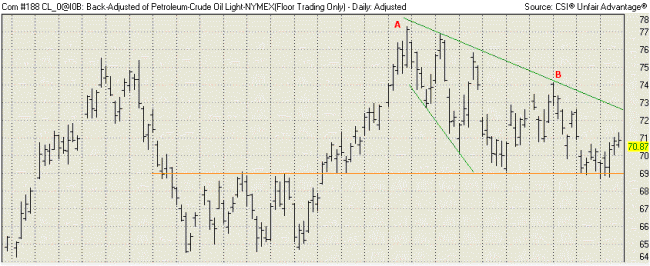
Crude Oil
Light Crude again respected intermediate support at $69. Last week I identified the pattern as a bearish descending triangle, with the upper border A-B and the lower border formed by support at $69. On reflection this may well be a broadening descending wedge, identified by the two green lines, with the partial decline of the last 3 weeks signaling that an upward breakout is imminent. Because of the risk of incorrect pattern identification, it would be advisable to wait for a rise above [B] to complete a further bullish pattern, a double bottom, with a likely test of resistance at $77.
Light Crude again respected intermediate support at $69. Last week I identified the pattern as a bearish descending triangle, with the upper border A-B and the lower border formed by support at $69. On reflection this may well be a broadening descending wedge, identified by the two green lines, with the partial decline of the last 3 weeks signaling that an upward breakout is imminent. Because of the risk of incorrect pattern identification, it would be advisable to wait for a rise above [B] to complete a further bullish pattern, a double bottom, with a likely test of resistance at $77.
Currencies
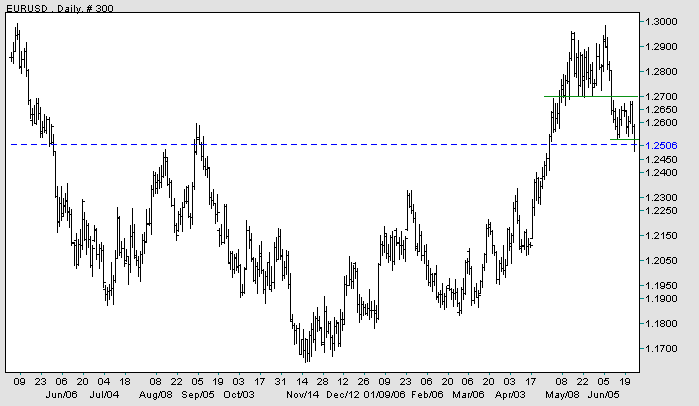
The dollar is strengthening in the short/medium-term.
EUR/USD: The euro closed below the narrow rectangle formed over the last 3 weeks and appears headed for a test of primary support at 1.17.
In the long-term, a fall below 1.17 would complete a major head and shoulders reversal (with a target of 0.97: 1.17 - (1.37 - 1.17)). A reversal above 1.30, on the other hand, would test the previous high of 1.37.
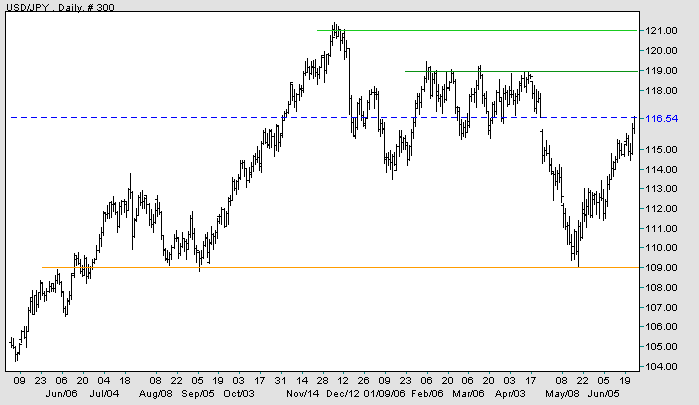
USD/JPY: The rising dollar faces intermediate resistance at 119
yen/dollar and primary resistance at 121.
In the long-term, a rise above the January 2006 high of 121 would break the bearish descending triangle started in 1998 and signal a primary up-trend. A fall below 100, on the other hand, would signal weakness.
In the long-term, a rise above the January 2006 high of 121 would break the bearish descending triangle started in 1998 and signal a primary up-trend. A fall below 100, on the other hand, would signal weakness.
Source: Netdania
United Kingdom
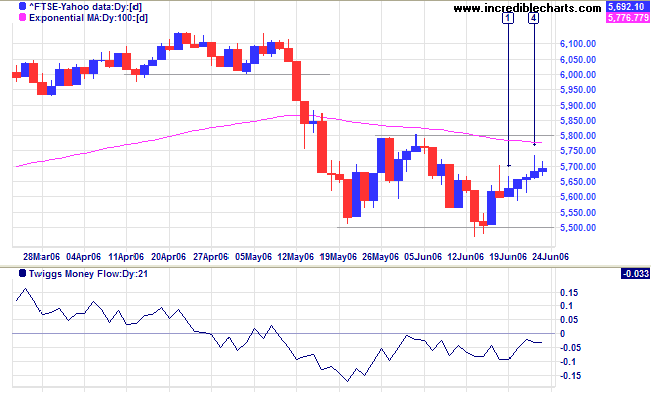
The FTSE 100 has so far respected support at 5500, but the attempted rally appears weak, with tall shadows at [1] and [4].
Medium Term: Twiggs Money Flow (21-day) remains below zero, warning of continued distribution. The index respecting support at 5800 (or the 100-day exponential moving average) would be a bearish sign; while a close below 5500 would signal a test of primary support at 5150; but a close above 5800 would complete a double bottom and signal another test of 6100.
Long Term: The FTSE 100 remains in a primary up-trend, although it may be entering a stage 3 top.
Japan
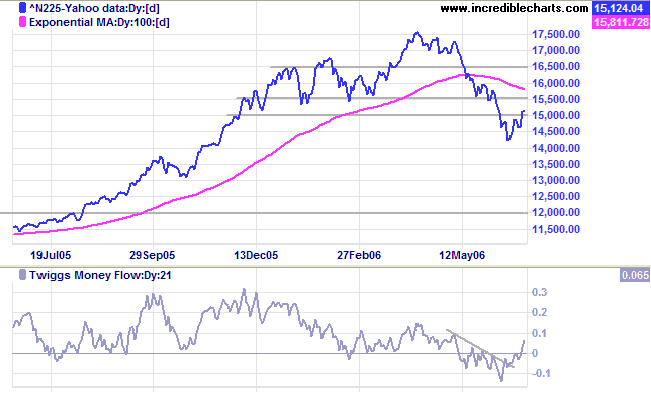
The Nikkei 225 reversed to above the former support level of 15000, warning of a possible bear trap.
Medium Term: Twiggs Money Flow (21-day) is rising fast, reflecting accumulation. A close above 15500 would confirm the reversal. If the index respects 15500, or the 100-day exponential moving average, the down-trend will continue.
Long Term: The index is in a primary down-trend, with the next level of support at 13000 and major support at 12000.
ASX Australia
The All Ordinaries formed another small rising wedge, similar to a flag, signaling continuation of the secondary correction. Strong volume at [4] indicates resistance at 5000. A close below Tuesday's low of 4820 would confirm the bearish continuation; while a close above 5000 would signal that the pattern has failed and the secondary correction is at an end.
The All Ordinaries formed another small rising wedge, similar to a flag, signaling continuation of the secondary correction. Strong volume at [4] indicates resistance at 5000. A close below Tuesday's low of 4820 would confirm the bearish continuation; while a close above 5000 would signal that the pattern has failed and the secondary correction is at an end.
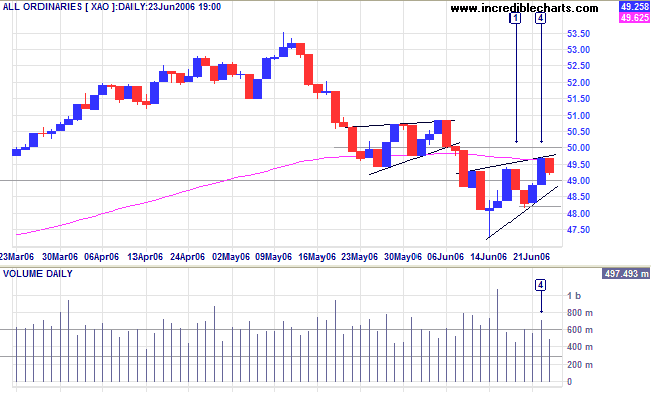
Medium Term: If the latest upswing respects the 100-day
exponential moving average, we are likely to see the
secondary correction test the lower border of the linear
regression channel; while a rise above the middle linear
regression line would be a bull signal.
Twiggs Money Flow (21-day) whipsaws around zero, indicating
uncertainty.
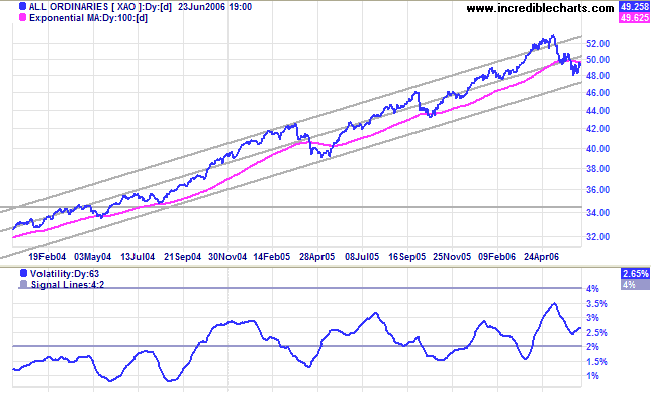
Long Term: The All Ordinaries is in a primary up-trend.
Rising volatility increases the likelihood of a stage
3 top.
For further background information, read About
the Trading Diary.
Regards,
Regards,
Colin Twiggs
There are risks and costs to a program of
action.
But they are far less than the long-range risks
and costs of comfortable inaction.
~ John F Kennedy
But they are far less than the long-range risks
and costs of comfortable inaction.
~ John F Kennedy

Author: Colin Twiggs is a former investment banker with almost 40 years of experience in financial markets. He co-founded Incredible Charts and writes the popular Trading Diary and Patient Investor newsletters.
Using a top-down approach, Colin identifies key macro trends in the global economy before evaluating selected opportunities using a combination of fundamental and technical analysis.
Focusing on interest rates and financial market liquidity as primary drivers of the economic cycle, he warned of the 2008/2009 and 2020 bear markets well ahead of actual events.
He founded PVT Capital (AFSL No. 546090) in May 2023, which offers investment strategy and advice to wholesale clients.