Trading Diary
June 10, 2006
These extracts from my daily trading diary are for educational
purposes and should not be interpreted as investment advice. Full
terms and conditions can be found at Terms
of Use.
USA
The Big Picture: Medium-term support has buckled on both
the Dow and NASDAQ
indexes, but support on the S&P 500,
though weakened, is still intact. A close below 1250 on this
broad market index would warn of a strong secondary correction,
with the three major indexes in sync.
The dollar is finding short-term support as interest rates rises appear inevitable. Though likely to support the dollar, thereby boosting export sales, higher rates will also dampen the property market -- and retail sales to a lesser degree. The Wright Model reflects the risk of an economic downturn as modest, but this could change if short-term rates continue to rise and/or the yield curve becomes inverted (if short-term rates rise faster than long-term yields).
While support for the dollar continues, gold may remain weak, but a decline (in the dollar) would most likely lead to another rally. Crude oil, the other major influence on the gold price, held above support at $68 and a further rise would be another bullish sign for gold.
The Dow Industrial Average fell below 11050, signaling a
secondary correction. Buying support is evident with the weak
close and large volume at [2] and again with the dragonfly
doji candle and strong volume at [4], but each time sellers
regain control and drive the index lower. Failure of the next
retracement to recover above 11050 (and the 100-day
exponential moving average) would be an intermediate bear
signal.
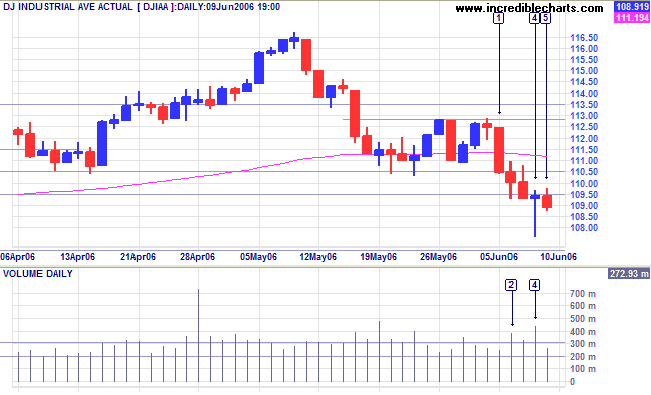
Medium Term: A rise above 11300 would signal resumption of
the up-trend; and a likely test of resistance at 11650.
Twiggs Money Flow (21-day) remains neutral.
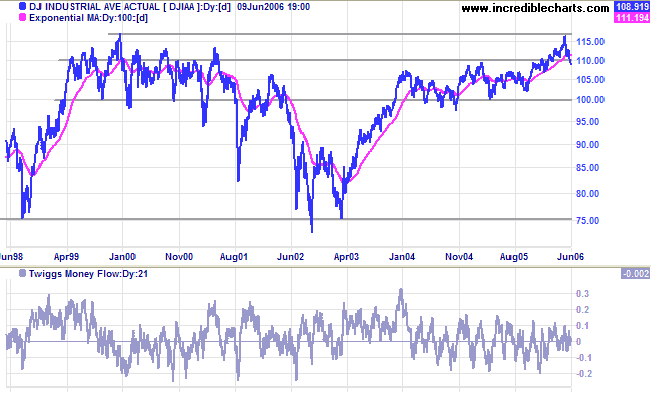
Long Term: Both the Dow Industrial and Transport Averages are in primary up-trends, confirming a bull market despite current turbulence. The Industrial Average retreated since testing resistance at the all-time high of 11600/11700. Above 11000 is bull territory, but the latest fall has pushed the index back into neutral territory, between 11000 and 10000; below the primary support level at 10000 would be bearish.
Long Term: Both the Dow Industrial and Transport Averages are in primary up-trends, confirming a bull market despite current turbulence. The Industrial Average retreated since testing resistance at the all-time high of 11600/11700. Above 11000 is bull territory, but the latest fall has pushed the index back into neutral territory, between 11000 and 10000; below the primary support level at 10000 would be bearish.
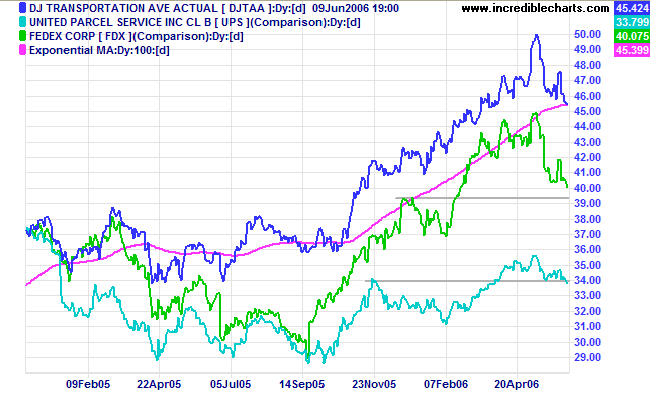
The Dow Jones Transportation Average again retraced to
test its 100-day
exponential moving average. The transport index and lead
indicators, Fedex and UPS, are all undergoing secondary
corrections, but remain in primary up-trends.
The S&P 500 started the week with a large red candle
at [1] before encountering committed support at 1250. The depth
of buying support is clear from the strong volume and narrow
range at [2] and the long tail and exceptional volume at the
hammer
candle at [4]. A close below 1250 would be bearish,
confirming the start of a secondary correction, while a rally
above 1290 would signal resumption of the up-trend.
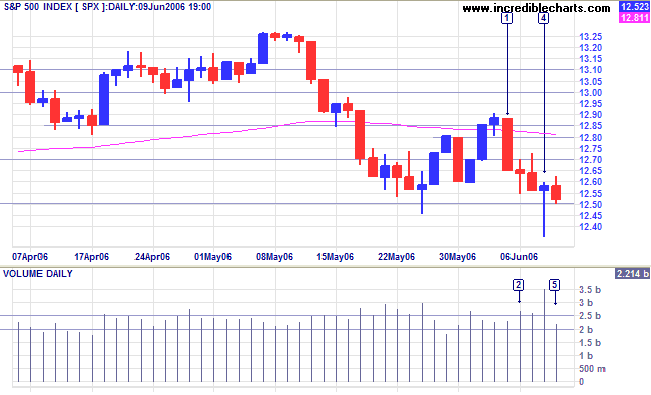
Medium Term:
Twiggs Money Flow (21-day) holds above zero, signaling
accumulation.
Long Term: The S&P 500 continues in a slow up-trend.
Long Term: The S&P 500 continues in a slow up-trend.
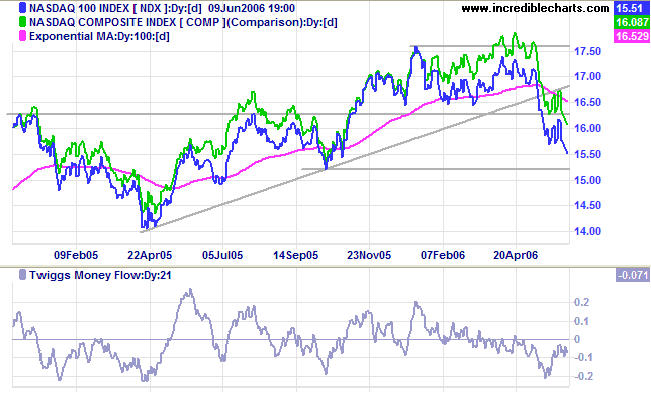
Contrastingly, the Nasdaq 100 fell sharply and appears
headed for a test of support at 1520. A fall below this level
would signal reversal to a primary down-trend, with bearish
implications for the entire equity market.
Twiggs Money Flow (21-day) remains below zero, signaling
medium-term
distribution.
Treasury yields
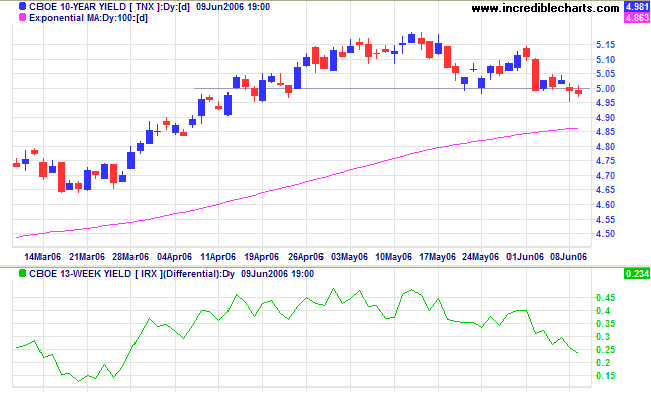
Expectations of further rate hikes are high and the 10-year treasury yield is likely to rise back above the 5.0% support level.
Medium Term: The Fed is likely to raise rates by another 0.25% at its June 28-29 meeting, ensuring that the 10-year yield will respect its 100-day exponential moving average and continue the up-trend.
Long Term: The yield differential (10-year T-notes minus 13-week T-bills) is falling. Low or negative yield differentials signal a flat or inverted yield curve. When combined with rising short-term interest rates this would be a bearish sign for the economy.
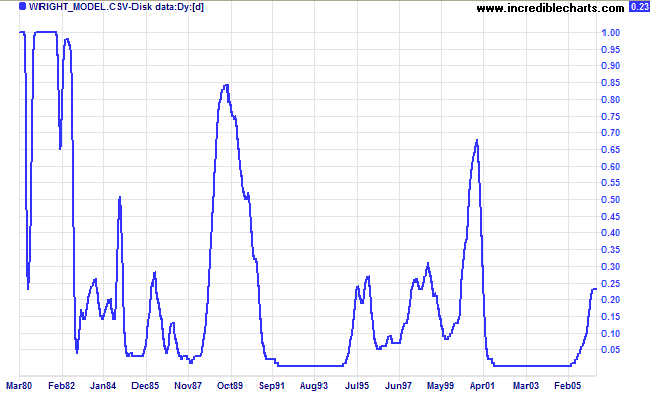
Wright Model
Developed by Fed economist Jonathan H Wright, the Wright Model combines the yield differential and fed funds rate to calculate the probability of recession. Looking ahead at the next four quarters, the probability is a modest 23%, but this could increase if short-term rates rise or the yield differential falls.
Developed by Fed economist Jonathan H Wright, the Wright Model combines the yield differential and fed funds rate to calculate the probability of recession. Looking ahead at the next four quarters, the probability is a modest 23%, but this could increase if short-term rates rise or the yield differential falls.
Gold
Spot gold is testing support at $600.
Medium Term: If support at $600 fails, we could see a test of primary support at $535. A stronger dollar would mean a weaker gold price.
Long Term: The gold-oil ratio remains below 10. Up-turns below 10 signal buying opportunities; down-turns above 20 are selling opportunities. Expect a recovery if the crude oil rally continues.
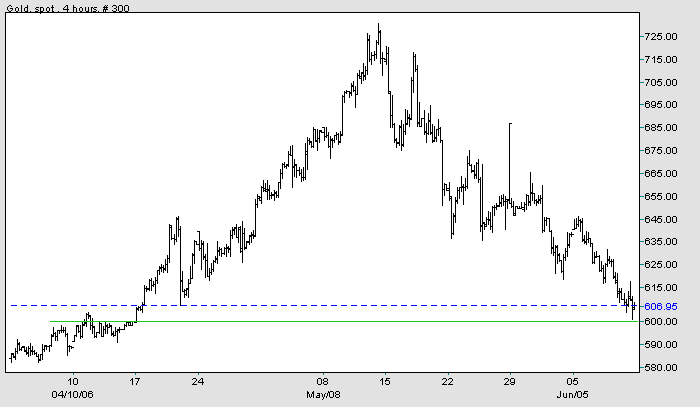
Source: Netdania
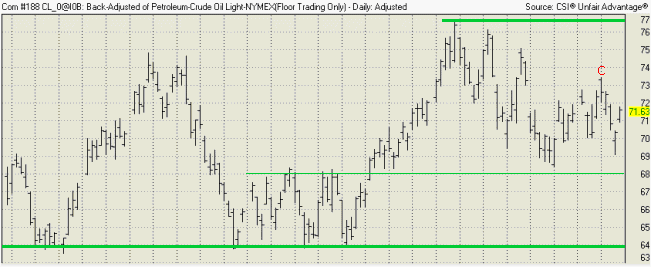
Crude Oil
Light Crude displayed some uncertainty with a dip below the previous trough of $70, but recovered to close Friday at $71.63. A rise above [C] would signal continuation of the rally and a test of resistance at $77. A fall below $68, on the other hand, is likely to test primary support at $64.
Light Crude displayed some uncertainty with a dip below the previous trough of $70, but recovered to close Friday at $71.63. A rise above [C] would signal continuation of the rally and a test of resistance at $77. A fall below $68, on the other hand, is likely to test primary support at $64.
Currencies
The dollar strengthened in the short-term after hawkish statements by Fed officials.
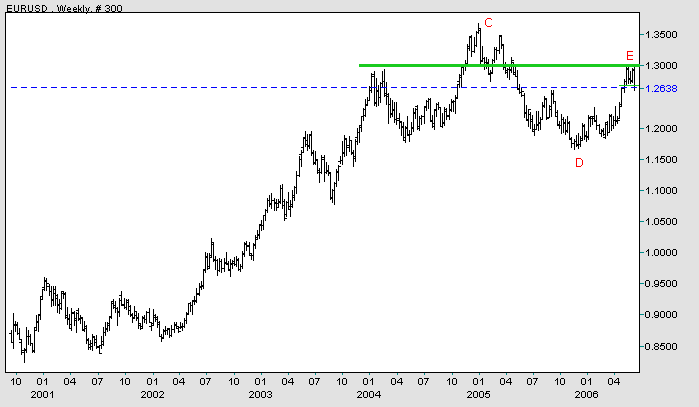
EUR/USD: The euro broke below the narrow rectangle formed at [E], signaling that a correction to test support at [D] is likely. A fall below [D] would complete a major head and shoulders reversal, while a rise above [E] is likely to test the previous high of [C]. The euro remains in a primary up-trend.
The dollar strengthened in the short-term after hawkish statements by Fed officials.
EUR/USD: The euro broke below the narrow rectangle formed at [E], signaling that a correction to test support at [D] is likely. A fall below [D] would complete a major head and shoulders reversal, while a rise above [E] is likely to test the previous high of [C]. The euro remains in a primary up-trend.
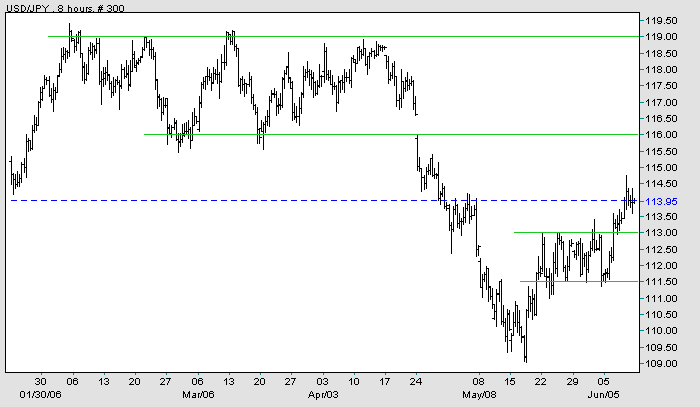
USD/JPY: The dollar broke above the rectangle
at 111/113 yen, signaling a secondary (medium-term) up-trend.
Expect initial resistance at 116 with primary resistance at 119.
The primary down-trend remains.
Source: Netdania
United Kingdom
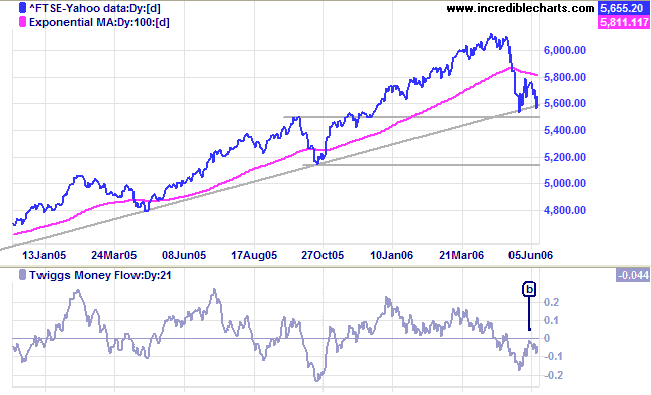
The FTSE 100 respected support (and the long-term trendline) at 5500.
Medium Term: The Twiggs Money Flow (21-day) peak below zero at [b], however, warns of distribution.
Long Term: The primary up-trend continues, with support at 5150.
The FTSE 100 respected support (and the long-term trendline) at 5500.
Medium Term: The Twiggs Money Flow (21-day) peak below zero at [b], however, warns of distribution.
Long Term: The primary up-trend continues, with support at 5150.
Japan
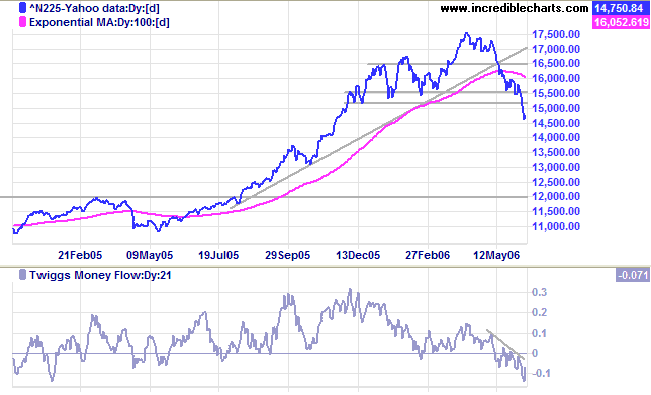
The Nikkei 225 completed a a stage 3 top, falling through support at 15000.
Medium Term: Twiggs Money Flow (21-day) signals strong distribution, trending downwards while below zero.
Long Term: The index has reversed to a primary down-trend. The next level of support is at 13000, with major support at 12000.
ASX Australia
The All Ordinaries did traders no favors this week, with a false break above 5070 at [1] before reversing to test support at 5000 on day [2]. The narrow range on day [3] showed uncertainty, before a large red candle on day [4]; the fall below 4950 signaling continuation of the secondary correction. The narrow bar on Friday, accompanied by strong volume, indicates continued buying support, but this may not last if US equities continue to fall.
The All Ordinaries did traders no favors this week, with a false break above 5070 at [1] before reversing to test support at 5000 on day [2]. The narrow range on day [3] showed uncertainty, before a large red candle on day [4]; the fall below 4950 signaling continuation of the secondary correction. The narrow bar on Friday, accompanied by strong volume, indicates continued buying support, but this may not last if US equities continue to fall.
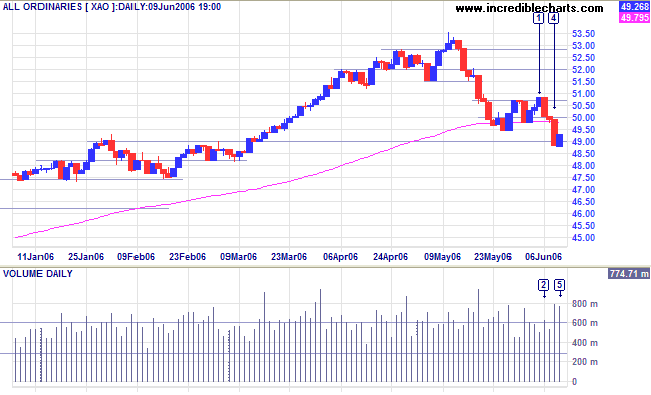
Medium Term: The secondary correction encountered support
at 4900. A close below that level would signal a test of the
lower border of the linear regression channel.
Twiggs Money Flow (21-day) is still below zero but trending
upwards: a positive sign.
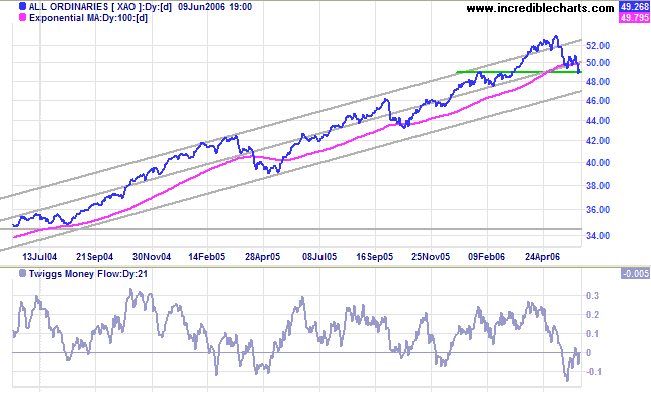
Long Term: The All Ordinaries remains in a primary
up-trend.
For further background information, read About
the Trading Diary.
Regards,
Regards,
Colin Twiggs
If we begin with certainties, we shall end in
doubts;
but if we begin with doubts, and are patient in them,
we shall end in certainties.
~ Francis Bacon
but if we begin with doubts, and are patient in them,
we shall end in certainties.
~ Francis Bacon

Author: Colin Twiggs is a former investment banker with almost 40 years of experience in financial markets. He co-founded Incredible Charts and writes the popular Trading Diary and Patient Investor newsletters.
Using a top-down approach, Colin identifies key macro trends in the global economy before evaluating selected opportunities using a combination of fundamental and technical analysis.
Focusing on interest rates and financial market liquidity as primary drivers of the economic cycle, he warned of the 2008/2009 and 2020 bear markets well ahead of actual events.
He founded PVT Capital (AFSL No. 546090) in May 2023, which offers investment strategy and advice to wholesale clients.