Trading Diary
June 3, 2006
These extracts from my daily trading diary are for educational
purposes and should not be interpreted as investment advice. Full
terms and conditions can be found at Terms
of Use.
USA
The Big Picture: Both the Dow and S&P 500 have found
support and a new high for the Dow would be a strong bull signal
for the entire equity market. The weakening dollar may boost export sales, but drive long-term interest rates, gold and
oil prices upwards. The Wright Model reflects the risk of an economic
downturn as modest and the bull market remains intact though we
can expect more turbulence ahead.
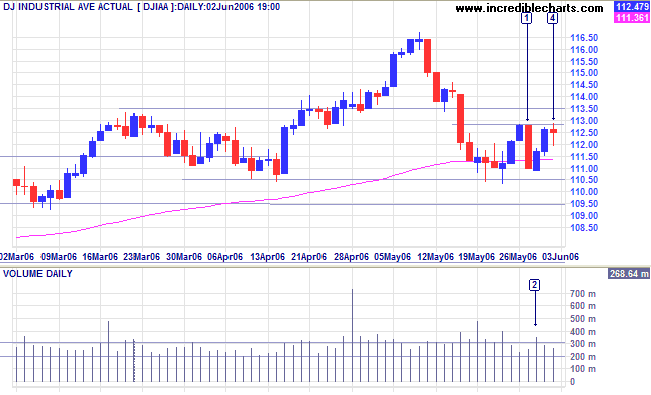
The Dow Industrial Average again tested 11050, with
increased volume [2] and a smaller range signaling strong
support. The index respected the 100-day
exponential moving average: a bullish sign.
Medium Term: A close above the high of [1] on the above
chart would complete a
double bottom, indicating that a test of resistance at 11650
is likely.
Twiggs Money Flow (21-day) is trending upwards, signaling
accumulation.
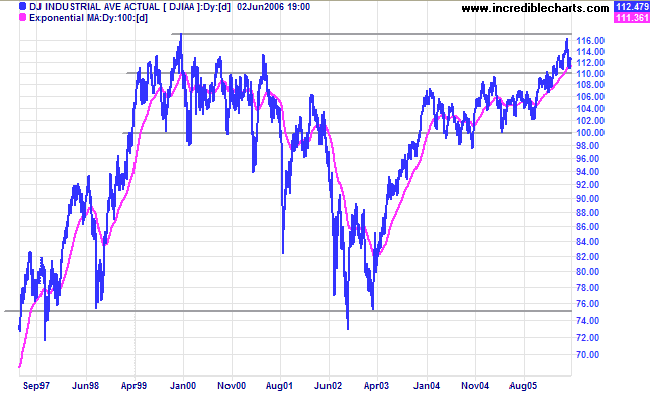
Long Term: Both the Dow Industrial and Transport Averages are in primary up-trends, confirming a bull market despite current turbulence. We need to remember that the Dow is poised to make a new all-time high if it can overcome resistance at 11600/11700. As long as the index holds above 11000 we are in bull territory. Between 11000 and 10000 is neutral, while below 10000 is bearish.
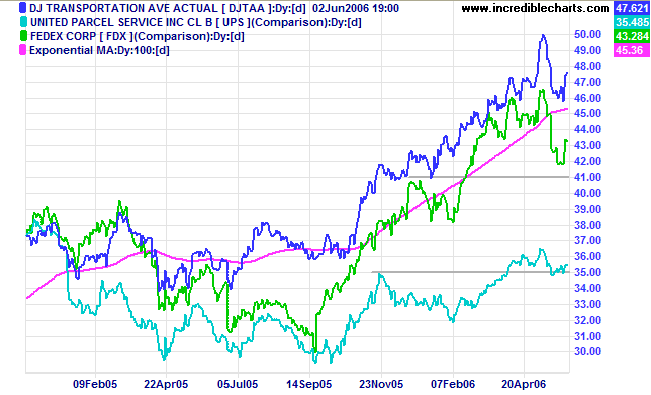
The Dow Jones Transportation Average respected its 100-day
exponential moving average, confirming that it is still in an
up-trend. Both Fedex and UPS held above their preceding highs
(from +/- 6 months ago): a bullish sign. All remain in primary
up-trends.
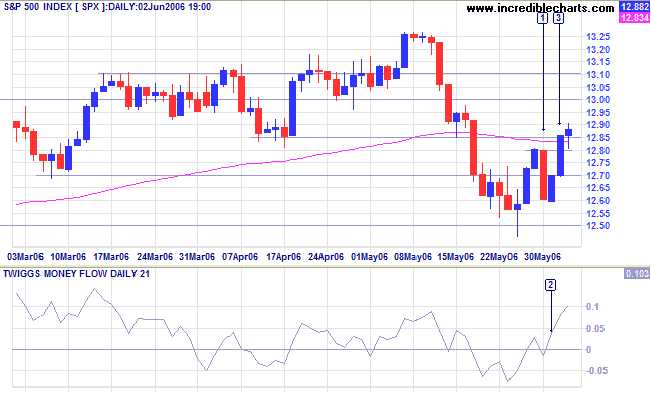
The S&P 500 formed a higher trough at [1] followed by
a new high at [3], signaling the start of a new up-trend. The
index also crossed to above its 100-day
exponential moving average.
Medium Term:
Twiggs Money Flow (21-day) confirms the up-trend at [2].
Expect a test of resistance at 1325.
Long Term: The S&P 500 is in a slow up-trend.
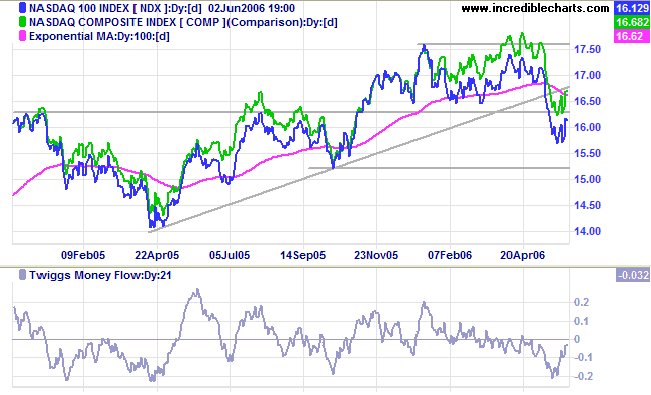
The Nasdaq 100 shows early signs of a recovery, with
Twiggs Money Flow (21-day) trending upwards and a small
double bottom on both the NDX and Composite indexes. This
would be confirmed if NDX recovers to above 1630. A fall below
1520, on the other hand, would signal reversal to a primary
down-trend.
Treasury yields
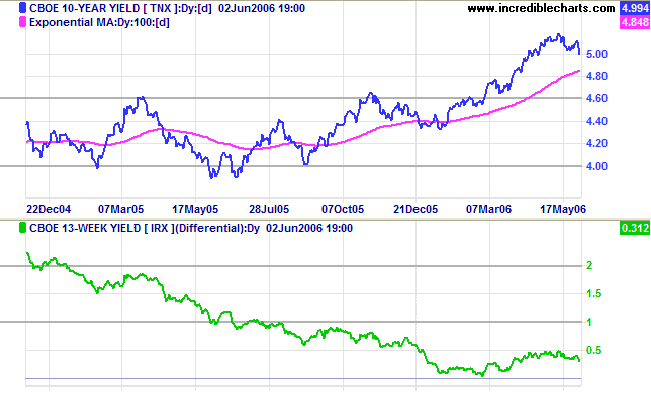
Weaker than expected May Employment figures restored hopes of a pause in interest rate hikes at the next Fed meeting; and the 10-year treasury yield continues to test support at 5.0%.
Medium Term: The Fed is likely to maintain its focus on inflation at its June 28-29 meeting unless further signs confirm that the economy is slowing. If the 10-year yield respects its 100-day exponential moving average, expect another rally.
Long Term: The yield differential (10-year T-notes minus 13-week T-bills) is edging lower. This is not a good sign as low yield differentials pose a significant threat when combined with higher short-term interest rates.
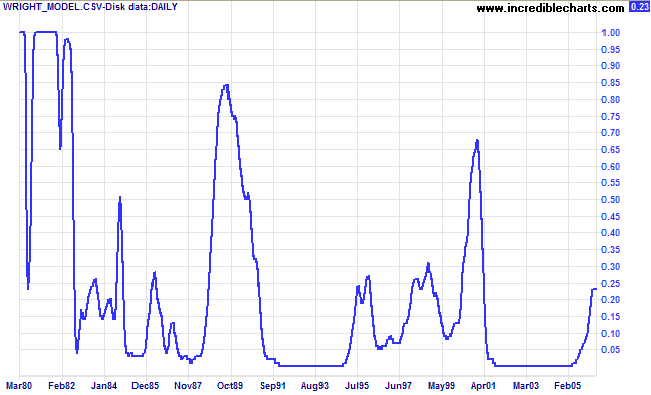
Wright Model
Developed recently by Fed economist Jonathan H Wright, the Wright Model combines the yield differential and fed funds rate to calculate the probability of recession. Looking ahead at the next four quarters, the probability remains a modest 23%.
Gold
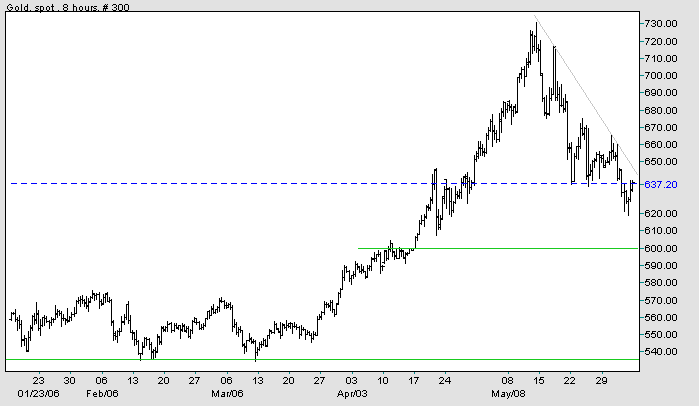
Spot gold broke through support at $640, continuing the sharp secondary correction. Expect further support at $600.
Medium Term: If support at $600 fails, we could see a test of primary support at $535. A weak dollar should support a strong gold price, limiting the potential downside.
Long Term: The gold-oil ratio remains below 10. Up-turns below 10 signal buying opportunities; down-turns above 20 are selling opportunities. Expect a rally if crude oil remains above $68/barrel.
Source: Netdania
Crude Oil
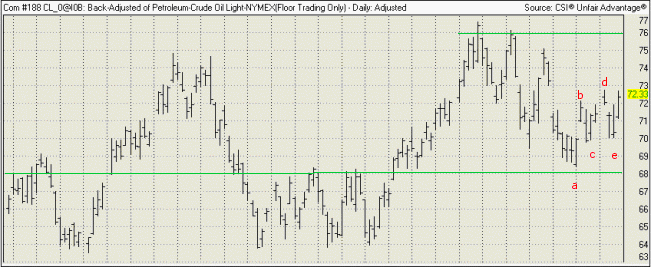
Crude respected support at $68 and is trending upwards, with a higher peak at [d] and higher troughs at [c] and [e], headed for a test of resistance at $76. A fall below $68, on the other hand, would be bearish.
Currencies
The dollar continues to weaken against major trading partners.
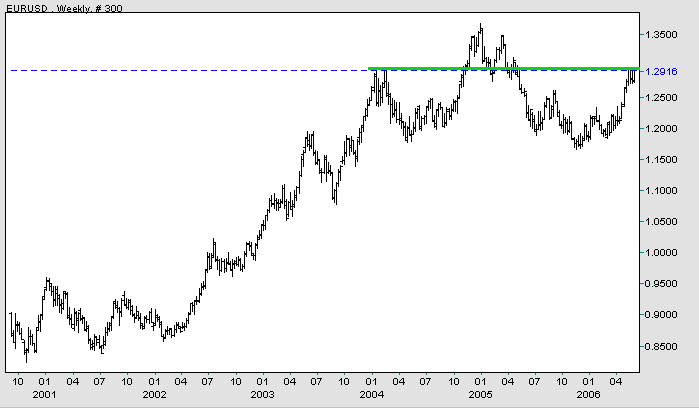
EUR/USD: The euro is consolidating in a narrow range below resistance at 1.30, signaling that the up-trend is likely to continue. A break above resistance would signal another test of 1.35/1.36. On the other hand, a fall below [D] would complete a major head and shoulders reversal. The euro remains in a primary up-trend.
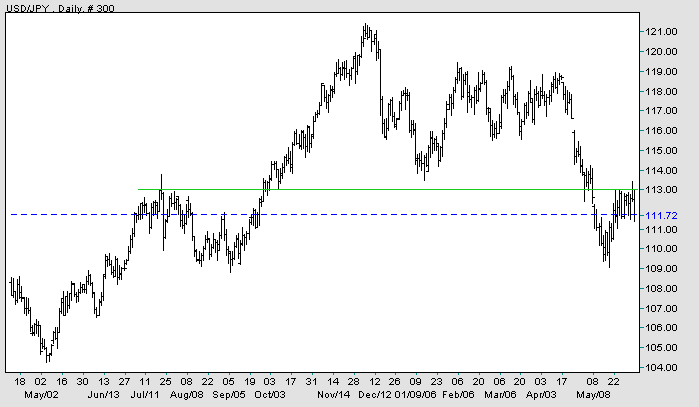
USD/JPY: Consolidation below 113 yen indicates that the dollar is
likely to strengthen in the short to medium term. The primary
down-trend continues.
Source: Netdania
United Kingdom
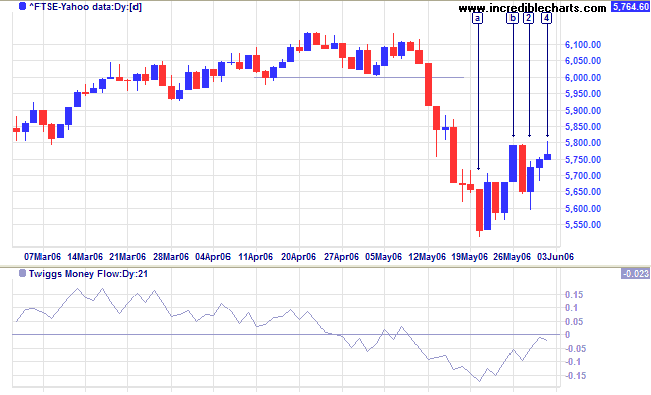
The FTSE 100 formed a higher trough at [2], but has not yet confirmed the up-trend with a close above the high of [b]. Failure to make a new high would signal another test of support (and the long-term trendline) at 5500.
Medium Term: Twiggs Money Flow (21-day) is trending upwards, signaling early accumulation.
Long Term: The FTSE 100 remains in a primary up-trend, with support at 5150.
Japan
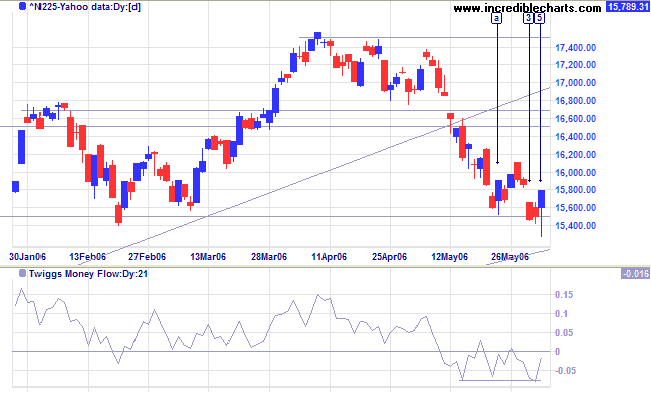
The Nikkei 225 respected primary support at 15500 three times in the last two weeks, the long tail and high volume at [5] signaling strong buying support.
Medium Term: The bullish divergence on Twiggs Money Flow (21-day) reflects support. Failure of support at 15500/15000 would signal a primary trend reversal, but, if support holds, expect a rally to test the previous high of 17500.
Long Term: The index may be forming a stage 3 top.
ASX Australia
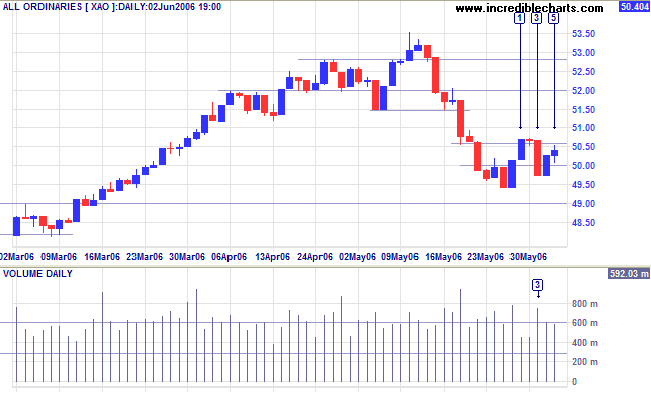
The All Ordinaries formed a higher trough at [3]. Wait for a new high, above 5070, to confirm the up-trend. Strong volume at [3] signals buying support at 5000, but a weak close at [5] shows that interest is waning.
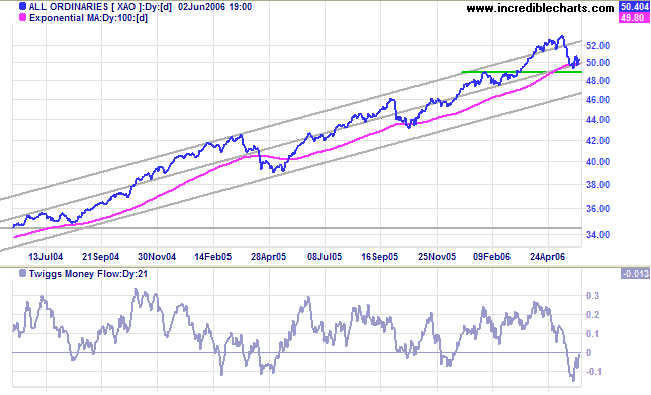
Medium Term: The index appears to have found support at
5000, with
Twiggs Money Flow (21-day) trending upwards, but a fall below
4900 would test the lower border of the linear regression
channel.
Long Term: The All Ordinaries continues in a strong
primary up-trend.
For further background information, read About
the Trading Diary.
Regards,
Regards,
Colin Twiggs
He that can have patience can have what he
will.
~ Benjamin Franklin
~ Benjamin Franklin