Trading Diary
May 27, 2006
These extracts from my daily trading diary are for educational
purposes and should not be interpreted as investment
advice.
Full terms and conditions can be found at Terms of Use.
Full terms and conditions can be found at Terms of Use.
USA
The Big Picture: Both the Dow and S&P 500 have found
support. Failure of current support would mean a test of primary
support levels. However, a rally that makes a new high for the
Dow would be a strong long-term bull signal for the entire equity
market. The weakening dollar may boost
export sales, but drive long-term interest
rates and oil prices upwards, offsetting
any positive benefit. The Wright Model
reflects the risk of an economic downturn as modest and the bull
market remains intact though we can expect some turbulence ahead.
The Dow Industrial Average found support at 11050 with
long tails and strong volume at [3]. Expect the rally to test
resistance at 11350.
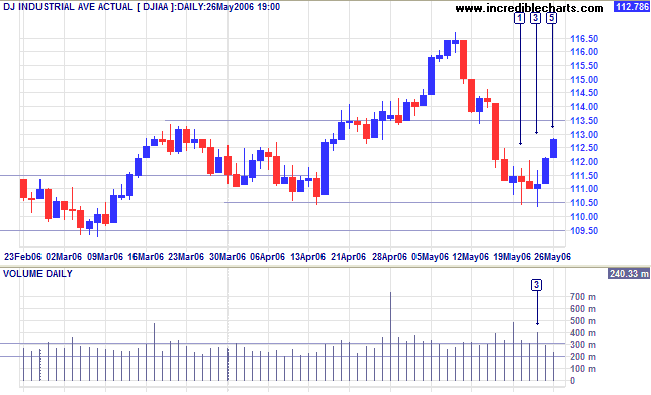
Medium Term: Expect another test of support followed by a
rally to test resistance at the recent high if successful. The
Dow continues to respect the 100-day
exponential moving average, signaling a strong up-trend.
Respect of support at 11000 is also bullish, while failure of
this level would mean a test of primary support at 10000.
Twiggs Money Flow (21-day) is uncertain.
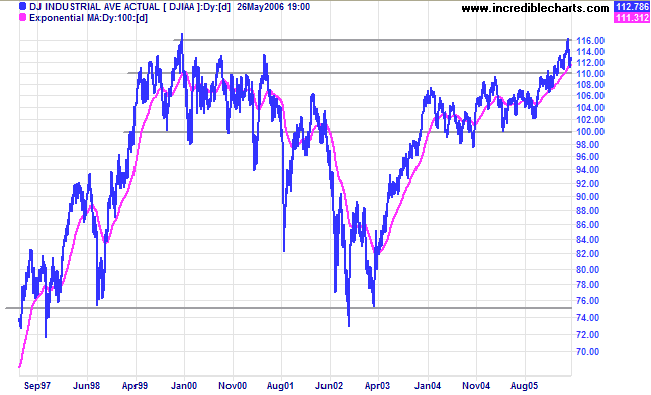
Long Term: Both the Dow Industrial and Transport Averages are in primary up-trends, confirming a bull market despite the current turbulence. A new high above 11600 would be a long-term bull signal for the Dow.
Long Term: Both the Dow Industrial and Transport Averages are in primary up-trends, confirming a bull market despite the current turbulence. A new high above 11600 would be a long-term bull signal for the Dow.
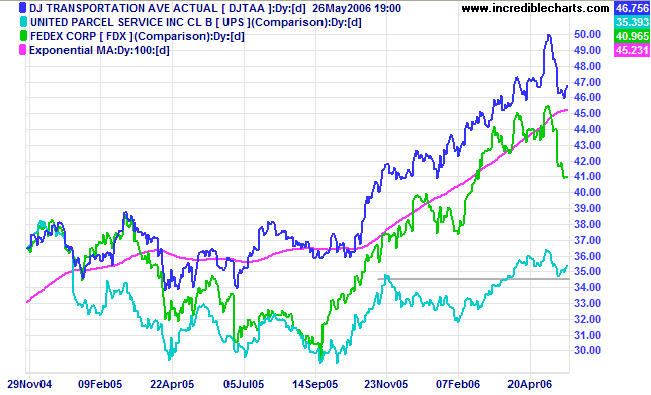
The Dow Jones Transportation Average and lead indicators
Fedex and UPS have all made secondary corrections, but remain in
primary up-trends.
The S&P 500 found support at 1250. The latest rally is
below the 100-day
exponential moving average and remains vulnerable.
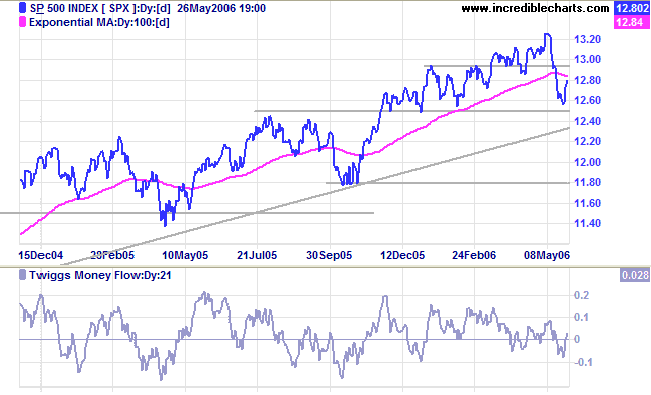
Medium Term: Expect another test of support at 1250,
followed by another test of the recent highs at 1325 if
successful. Failure of support at 1250, however, would signal a
test of primary support at 1180.
Twiggs Money Flow (21-day) shows uncertainty.
Long Term: The index is in a slow up-trend.
Long Term: The index is in a slow up-trend.
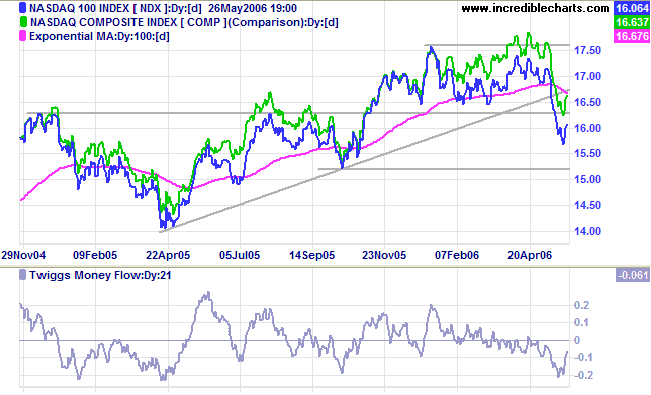
The Nasdaq 100 remains weak, with
Twiggs Money Flow (21-day) signaling strong
distribution. A fall below 1520 would signal reversal to a
primary down-trend.
Treasury yields
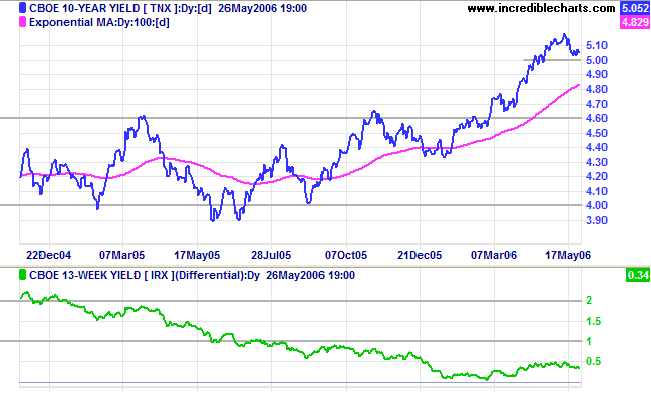
The 10-year treasury yield retraced to test support at 5.0% after signs that durable goods orders and the housing market may be slowing.
Medium Term: Latest year-on-year inflation figures are above the accepted 1% to 2% target range and another rate hike is likely at the Fed's June 28-29 meeting. Long-bond yields can be expected to rally to above recent highs.
Long Term: The yield differential (10-year T-notes minus 13-week T-bills) is drifting sideways. This is not a good sign: low yield differentials pose a significant threat if short-term interest rates rise.
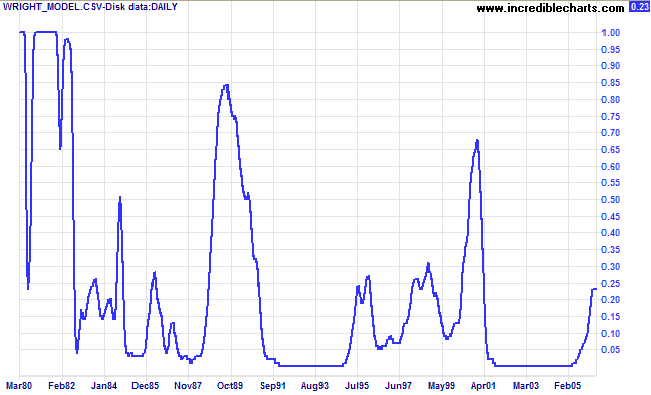
Wright Model
Developed recently by Fed economist Jonathan H Wright, the Wright Model combines the yield differential and fed funds rate to calculate the probability of recession. Looking ahead at the next four quarters, the probability remains a modest 23%.
Developed recently by Fed economist Jonathan H Wright, the Wright Model combines the yield differential and fed funds rate to calculate the probability of recession. Looking ahead at the next four quarters, the probability remains a modest 23%.
Gold
After testing support at $640 for several days, spot gold recovered to close at $650.80 in New York on Friday.
Medium Term: Expect an attempted rally followed by another test of support.
Long Term: The gold-oil ratio is below 10 and trending upwards. Down-turns above 20 indicate selling opportunities. Expect gold to make further gains if crude oil holds above $68/barrel.
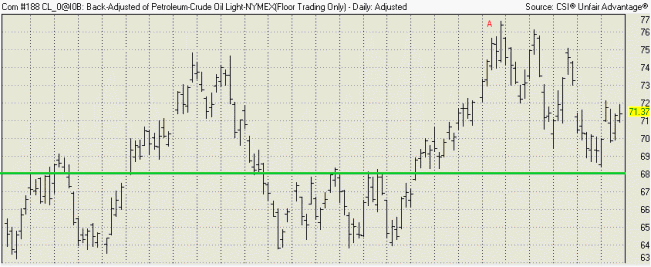
Crude Oil
Crude respected support at $68 before rallying to $71.37/barrel. A rise above $72 would signal that a test of resistance at the recent high of [A] can be expected. A fall below $68, on the other hand, would be a bear signal; confirmed if a retracement respects the new resistance level.
Crude respected support at $68 before rallying to $71.37/barrel. A rise above $72 would signal that a test of resistance at the recent high of [A] can be expected. A fall below $68, on the other hand, would be a bear signal; confirmed if a retracement respects the new resistance level.
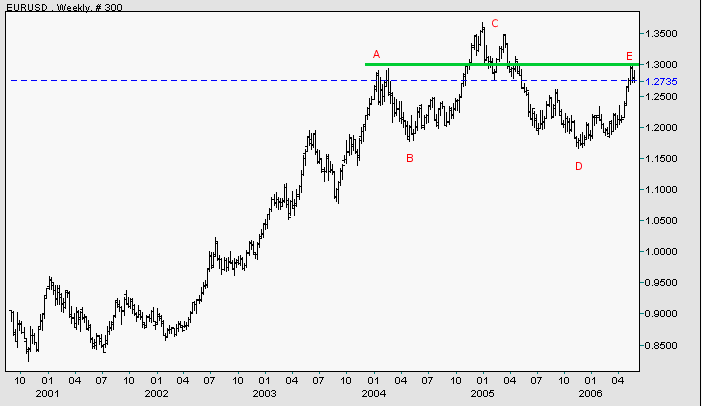
Currencies
The dollar is weakening against major trading partners.
EUR/USD: The euro is consolidating below resistance at 1.30, from [A]. A rise above [E] would signal another attempt at 1.35/1.36, while a fall below [D] would complete a major head and shoulders reversal. The euro remains in a primary up-trend.
USD/JPY: The dollar found support at 109 against the yen is
retracing to test resistance at the previous support level of 114
[d]. The primary down-trend continues.
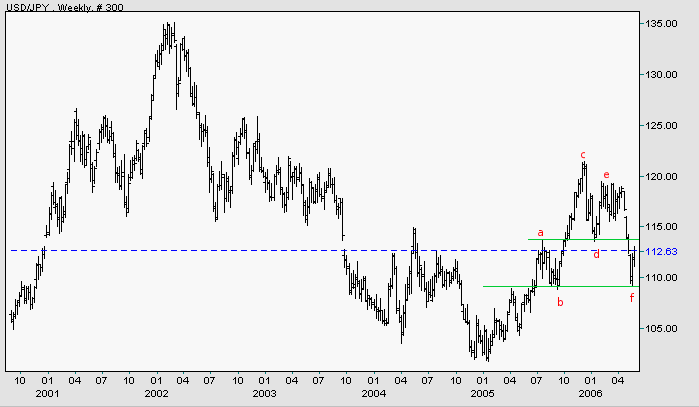
Source: Netdania
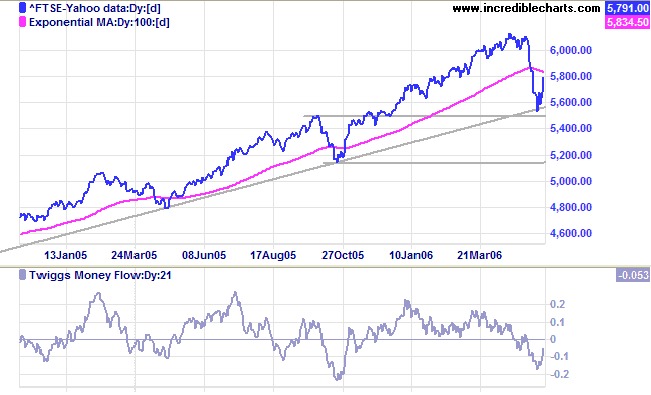
United Kingdom
The FTSE 100 consolidated for 4 days above support (and the long-term trendline) at 5500 before rallying strongly on Friday, signaling a likely end to the secondary correction.
Medium Term: The index is below the 100-day exponential moving average so we should not rule out further downside. Twiggs Money Flow (21-day) below zero confirms medium-term distribution.
Long Term: The FTSE 100 remains in a primary up-trend, with primary support at 5150.
Japan
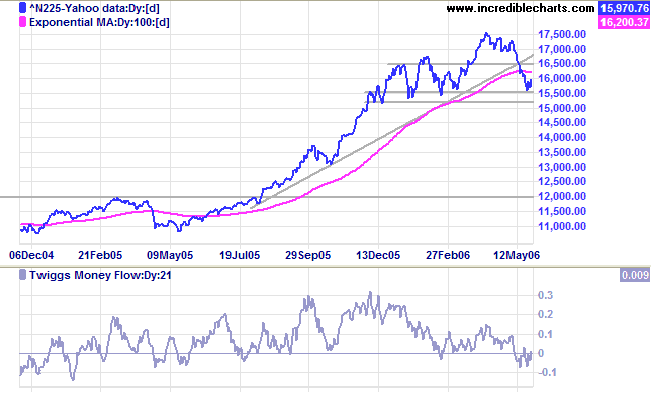
The Nikkei 225 is testing primary support at 15500/15000.
Medium Term: Twiggs Money Flow (21-day) formed a bullish divergence: the first signs of a recovery. If support at 15500/15000 holds, expect a rally to test the previous high of 17500. If support fails, however, the primary trend will reverse downwards.
Long Term: The primary trend may be forming a stage 3 top.
ASX Australia
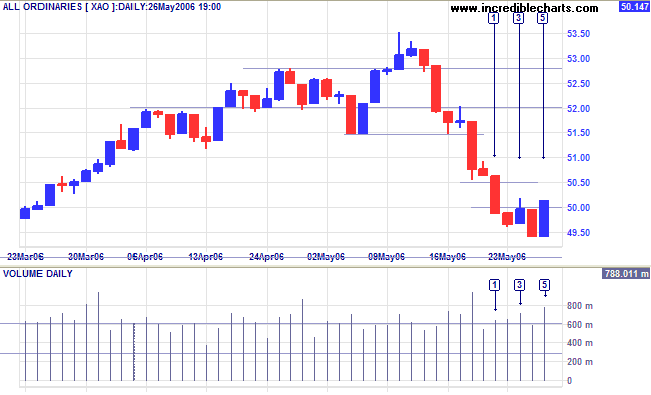
The All Ordinaries started the week with a strong red candle [1] breaking short-term support at 5050 and closing below 5000. Consolidation in a narrow range at [2] was followed by an attempted rally which met strong resistance: indicated by a tall shadow and large volume at [3]. The tall blue candle and strong volume at [5] signal that buyers have regained control. A follow-through above the high of [3] would be a weak signal that the down-trend has reversed; confirmed if a higher trough is followed by a new high. Continuation of the down-trend, on the other hand, would be signaled if there is a fall below the low of day [4].
The All Ordinaries started the week with a strong red candle [1] breaking short-term support at 5050 and closing below 5000. Consolidation in a narrow range at [2] was followed by an attempted rally which met strong resistance: indicated by a tall shadow and large volume at [3]. The tall blue candle and strong volume at [5] signal that buyers have regained control. A follow-through above the high of [3] would be a weak signal that the down-trend has reversed; confirmed if a higher trough is followed by a new high. Continuation of the down-trend, on the other hand, would be signaled if there is a fall below the low of day [4].
Medium Term: The secondary correction found support above
the January high, but there is a reasonable chance of a further
fall testing the lower border of the linear regression channel.
Twiggs Money Flow (21-day) well below zero confirms
medium-term distribution.
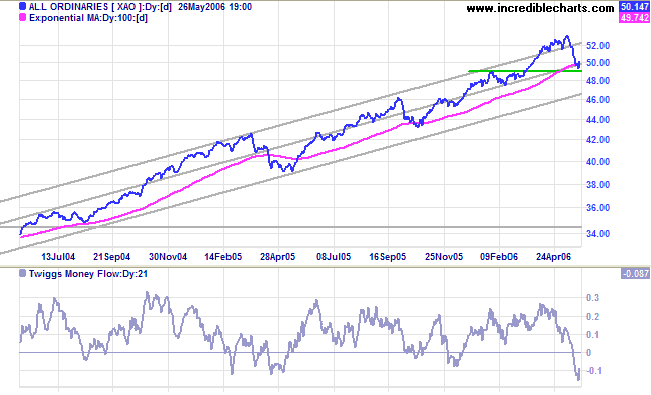
Long Term: The All Ordinaries remains in a strong primary
up-trend.
For further background information, read About
the Trading Diary.
Regards,
Regards,
Colin Twiggs
In this game, the market has to keep pitching, but you don't have
to swing.
You can stand there with the bat on your shoulder for six months until you get a fat pitch.
~ Warren Buffett
You can stand there with the bat on your shoulder for six months until you get a fat pitch.
~ Warren Buffett

Author: Colin Twiggs is a former investment banker with almost 40 years of experience in financial markets. He co-founded Incredible Charts and writes the popular Trading Diary and Patient Investor newsletters.
Using a top-down approach, Colin identifies key macro trends in the global economy before evaluating selected opportunities using a combination of fundamental and technical analysis.
Focusing on interest rates and financial market liquidity as primary drivers of the economic cycle, he warned of the 2008/2009 and 2020 bear markets well ahead of actual events.
He founded PVT Capital (AFSL No. 546090) in May 2023, which offers investment strategy and advice to wholesale clients.