Trading Diary
May 13, 2006
These extracts from my daily trading diary are for educational
purposes and should not be interpreted as investment advice. Full
terms and conditions can be found at Terms
of Use.
Shave For a Cure
Many thanks to our readers for their generosity and to Ivan for helping to focus support for this worthy cause.
Many thanks to our readers for their generosity and to Ivan for helping to focus support for this worthy cause.
USA
| The Big Picture |
| Equity markets show short-term weakness, but remain in primary up-trends and transport indicators continue to signal increasing economic activity. A weakening dollar may boost export sales, but will drive long-term interest rates and oil prices upwards, offsetting any positive benefit to equity markets. The Wright Model reflects the risk of an economic downturn in the next four quarters as a modest 23%. The bull market is intact, though we can expect some turbulence before the market grows accustomed to the new leadership style at the Fed. |
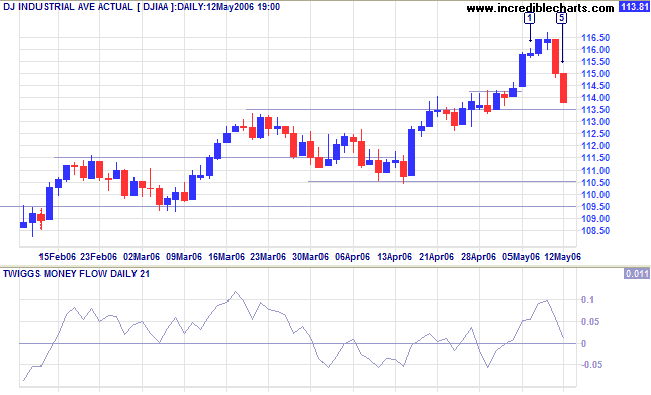
The Dow Industrial Average retraced sharply in the last
two days on concerns over rising oil and gold prices, a falling
dollar and a sharp fall in preliminary May consumer sentiment
figures from the University of Michigan (79.0 compared to 87.4 in
April).
Medium Term: A close below 11350 would signal a test of primary support at 11050. Twiggs Money Flow (21-day) is close to zero, indicating uncertainty.
Long Term: The Dow remains in a primary up-trend, with Dow Theory confirming a bull market: both Industrial and Transport Averages are in primary up-trends.
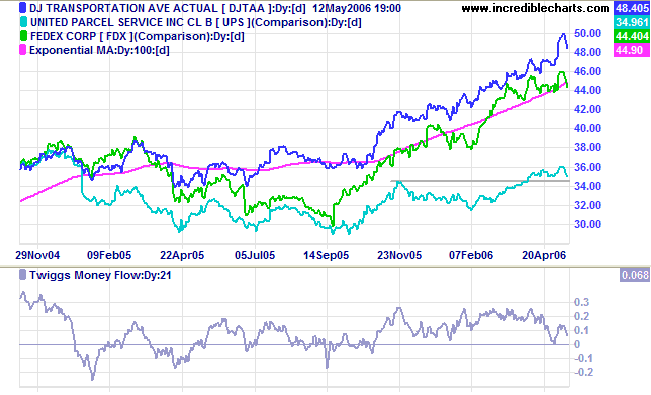
The Dow Jones Transportation Average and lead indicators,
Fedex and UPS, appear headed for short/medium-term weakness, but
remain in primary up-trends -- a long-term bull signal for the
economy.
The S&P 500 turned down sharply on Thursday/Friday and
is headed for a test of medium-term support at 1285.
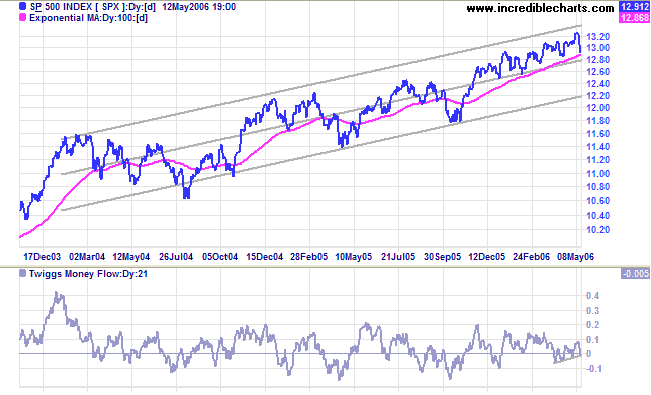
Medium Term: A close below 1285 and fall below the 100-day
exponential moving average (or linear regression line) would
signal the start of a secondary correction. The index has
respected both the MA and linear regression line since the
beginning of the year (the standard deviation channel is drawn
with parallel lines fitted at 2 standard deviations around a
linear regression line). A secondary correction would most likely
test support at the lower edge of the channel.
Twiggs Money Flow (21-day) is back at zero, but the up-trend
suggests longer-term
accumulation.
Long Term: The index is in a slow up-trend, with primary support at 1180.
Long Term: The index is in a slow up-trend, with primary support at 1180.
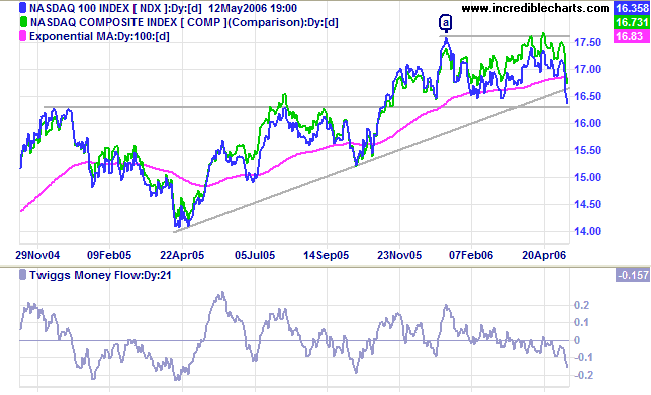
The Nasdaq 100 is headed for a test of support at 1630,
after consolidating between 1630 and 1760 for several months.
Twiggs Money Flow (21-day) is below zero and trending
downwards, indicating long-term
distribution. A fall below 1630 would be cause for
concern, signaling reversal to a primary down-trend.
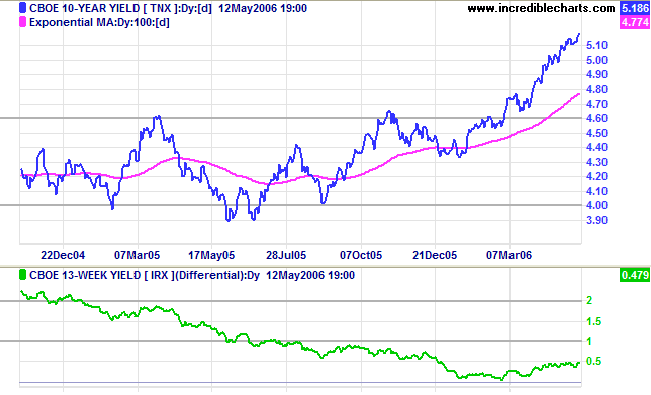
Treasury yields
The 10-year treasury yield continues in a strong up-trend, aided by the decline of the dollar and the possibility of central banks diversifying their holdings into euros.
Medium Term: The Fed raised the fed funds rate another quarter point to 5.0%. Increased concerns about inflation suggest that the expected pause in rate hikes is far from certain. The real estate market is likely to be worst affected by rising long-term rates, while banks will benefit from wider margins.
Long Term: The yield differential (10-year T-notes minus 13-week T-bills) is trending slowly upwards. This is a good sign as a low yield differential poses a significant threat when short-term interest rates are high.
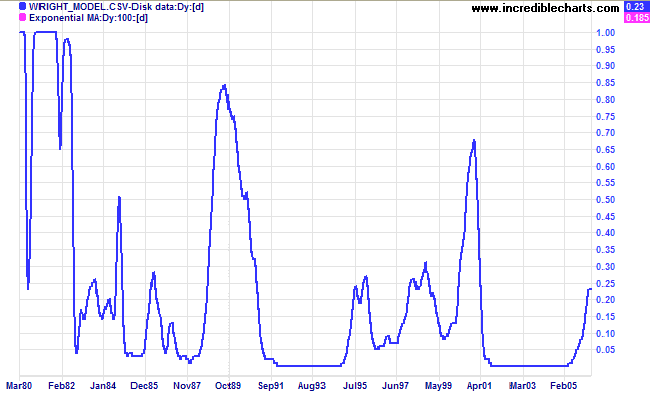
Wright Model
Developed recently by Fed economist Jonathan H Wright, the Wright Model combines the yield differential and fed funds rate to calculate the probability of recession. Looking ahead at the next four quarters, the probability remains a modest 23%.
Developed recently by Fed economist Jonathan H Wright, the Wright Model combines the yield differential and fed funds rate to calculate the probability of recession. Looking ahead at the next four quarters, the probability remains a modest 23%.
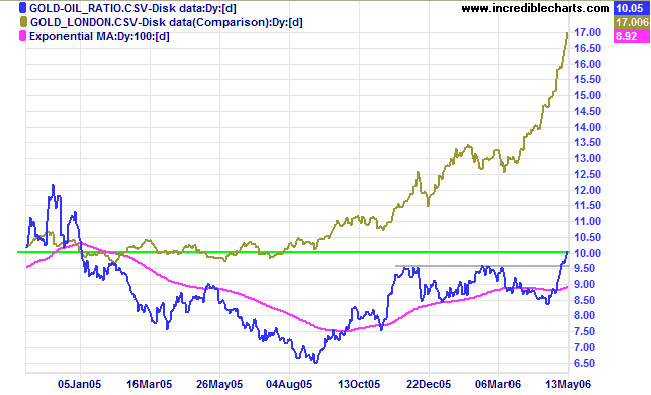
Gold
Speculators are driving the gold price higher, aided by the weakening dollar. The Friday New York close for spot gold is $710.50 after briefly flirting with $730.
Medium Term: Gold is making an upward spike -- identified by strong rallies and short retracements/consolidations lasting only a few days. Expect strong gains followed by a sharp reversal.
Long Term: The gold-oil ratio confirmed the up-trend with a rise above 9.50. Up-turns below 10 normally signal good buying opportunities, while down-turns above 20 indicate selling opportunities. Expect further gains if crude oil remains above $70/barrel.
Data Source: Global
Financial Data
Crude Oil
Light Crude recovered to $72.04, after testing support at $70/barrel. The successful test is a strong bull signal for gold and oil prices. Look for confirmation from a breakout above the recent high of $75/barrel. Though less likely, a close below $70 would indicate weakness.
Light Crude recovered to $72.04, after testing support at $70/barrel. The successful test is a strong bull signal for gold and oil prices. Look for confirmation from a breakout above the recent high of $75/barrel. Though less likely, a close below $70 would indicate weakness.
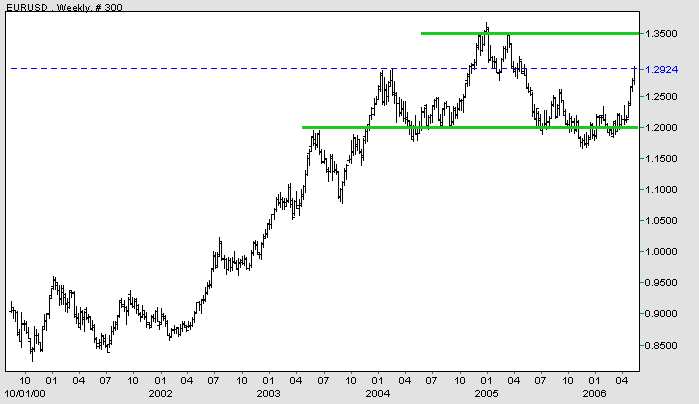
Currencies
The dollar is weakening against major trading partners.
EUR/USD: The euro is in a strong up-trend against the dollar, headed for a test of resistance at 1.35/1.36.
The dollar is weakening against major trading partners.
EUR/USD: The euro is in a strong up-trend against the dollar, headed for a test of resistance at 1.35/1.36.
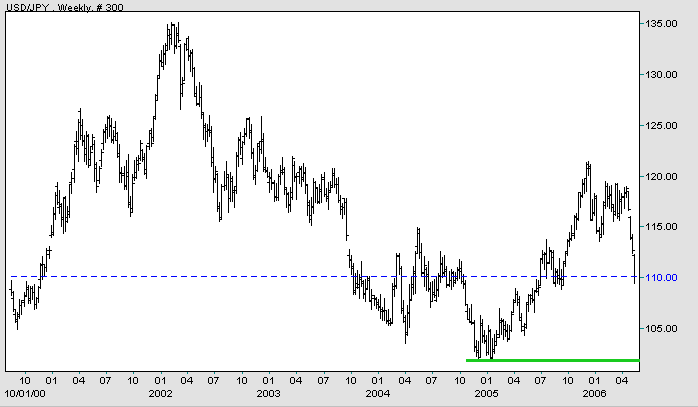
USD/JPY: The dollar is in a primary down-trend, headed for a test
of support at 102 yen.
Source: Netdania
United Kingdom
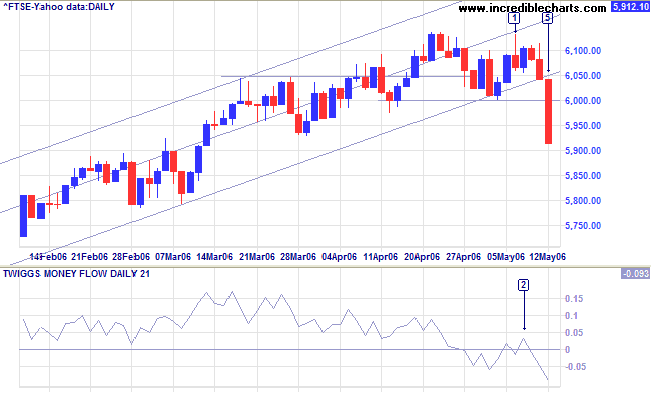
The FTSE 100 respected the linear regression line (from below) at [1] before falling sharply through the lower border of the channel at [5], breaking support at 6000 and signaling the start of a secondary correction.
Medium Term: Twiggs Money Flow (21-day) climbed slightly above zero at [2] before falling sharply below the previous low; a strong bear signal. Expect a secondary correction to test support at the October 2005 high of 5500.
Long Term: The FTSE 100 remains in a primary up-trend, with primary support at 5150.
Japan
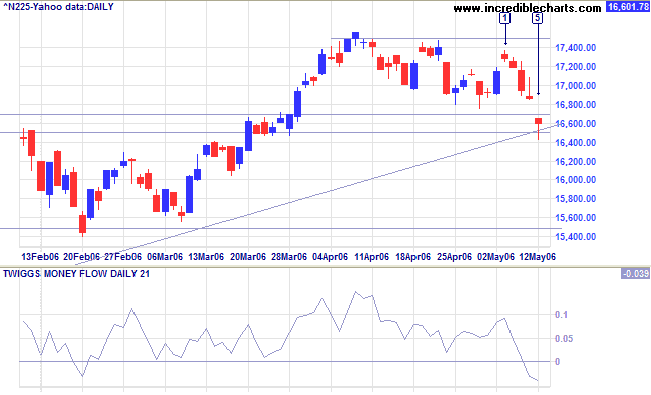
The Nikkei 225 broke through support at 16700/16800 but encountered strong buying at 16500 (the January 2006 high), with a long tail and sizable volume.
Medium Term: If support holds, expect another test of resistance at 17500; but if support fails, expect a secondary correction to test the January/February lows of 15500. Twiggs Money Flow (21-day) below zero signals short-term distribution.
Long Term: The primary up-trend continues.
ASX Australia
The All Ordinaries breakout above 5280 is unconvincing, with a tall shadow and strong volume signaling distribution at [3]. The subsequent inside day and red candle signal uncertainty. While there does seem to be buying taking place at the new 5280 support level, I suspect that this may not hold.
The All Ordinaries breakout above 5280 is unconvincing, with a tall shadow and strong volume signaling distribution at [3]. The subsequent inside day and red candle signal uncertainty. While there does seem to be buying taking place at the new 5280 support level, I suspect that this may not hold.
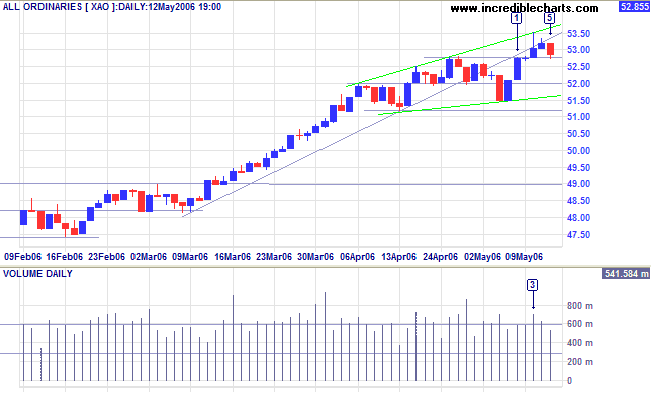
Medium Term: The rising broadening wedge pattern,
identified by green lines on the above chart, is a reversal
signal (thanks to Matthew for drawing my attention to this). A
lower peak would be a strong bear signal (84% reliability
according to Tomas Bulkoswki's Encyclopedia of Chart Patterns),
while a rise above 5350 (Wednesday's High) would be indicate that
the pattern is likely to fail. The recent
divergence on
Twiggs Money Flow (21-day) signals short/medium-term
weakness.
The index remains above the upper border of a long-term regression channel, indicating an accelerating up-trend. Accelerating trends are unsustainable and often evolve into a spike followed by a sharp reversal.
The index remains above the upper border of a long-term regression channel, indicating an accelerating up-trend. Accelerating trends are unsustainable and often evolve into a spike followed by a sharp reversal.
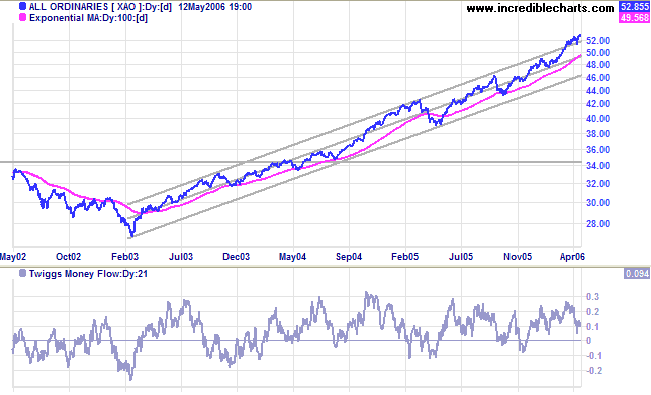
Long Term: The All Ordinaries continues in a strong
primary up-trend.
For further background information, read About
the Trading Diary.
Regards,
Regards,
Colin Twiggs
Every strike brings me closer to the next home run.
~ Babe Ruth
~ Babe Ruth

Author: Colin Twiggs is a former investment banker with almost 40 years of experience in financial markets. He co-founded Incredible Charts and writes the popular Trading Diary and Patient Investor newsletters.
Using a top-down approach, Colin identifies key macro trends in the global economy before evaluating selected opportunities using a combination of fundamental and technical analysis.
Focusing on interest rates and financial market liquidity as primary drivers of the economic cycle, he warned of the 2008/2009 and 2020 bear markets well ahead of actual events.
He founded PVT Capital (AFSL No. 546090) in May 2023, which offers investment strategy and advice to wholesale clients.