Trading Diary
April 29, 2006
The S&P 500 continues to encounter stubborn resistance between 1310 and 1320, with tall shadows for the last three days and strong volume at [4]. A breakout above 1320 would signal continuation of the slow up-trend, while a fall below 1295 would signal weakness -- and a close below 1285 would confirm the start of a secondary correction.
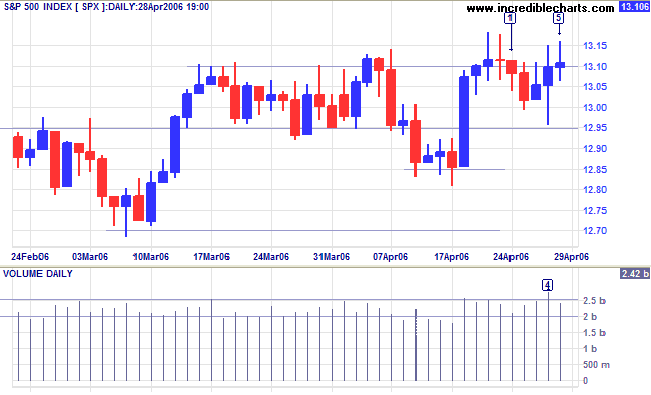
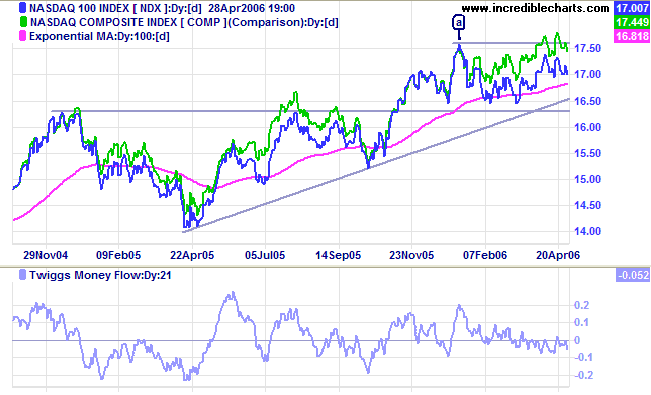
Long Term: The index is in a slow primary up-trend, with support at 1180.
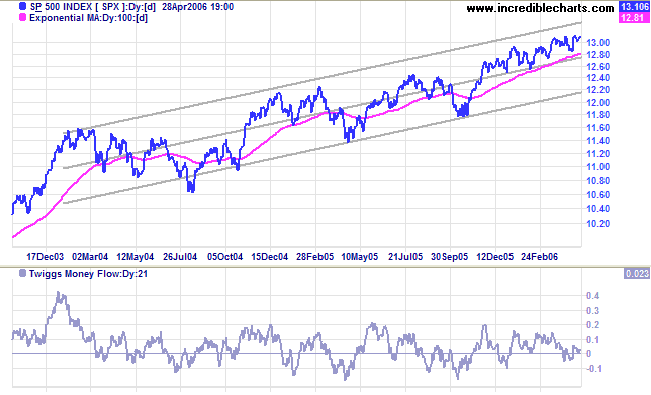
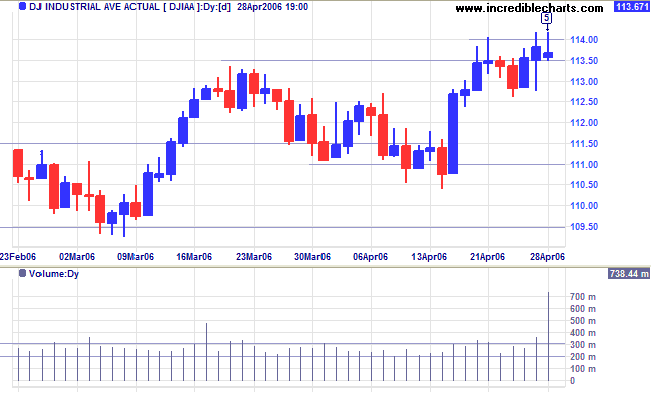
Medium Term: Twiggs Money Flow (21-day) is whipsawing around the zero line, signaling uncertainty. This suggests that another test of support at 11100 is likely.
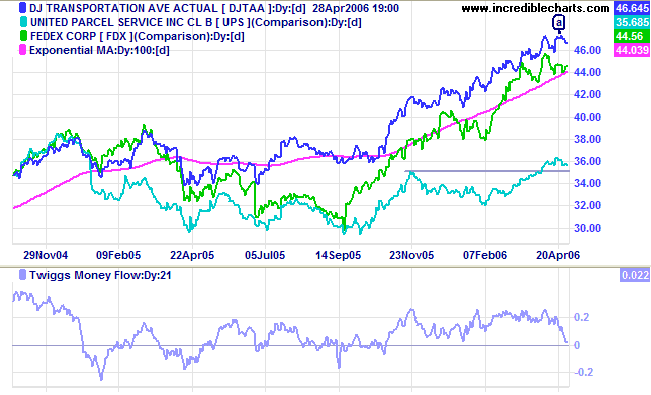
Long Term: The primary up-trend continues. Dow Theory confirms a bull market with both Industrial and Transport Averages in primary up-trends.
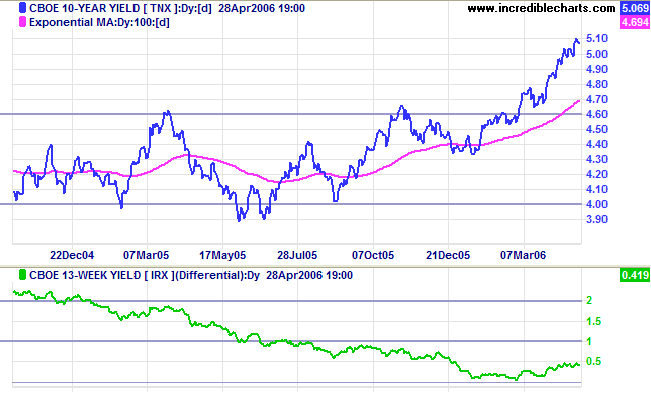
The 10-year treasury yields continue their up-trend after respecting support at 5%.
Medium Term: Chairman Bernanke's testimony before Congress hinted at a pause in future rate hikes. This was supported by strong GDP figures from the Commerce Department, accompanied by indications that inflationary pressures are easing. Expect rates to be raised another quarter point to 5.0% at the next Fed meeting, followed by a pause while the Fed evaluates the effectiveness of recent measures.
Long Term: The yield differential (10-year T-notes minus 13-week T-bills), though low, is trending upwards. This allows the Fed more scope to increase interest rates should it become necessary.
|
Spot gold climbed sharply to close at $651.60, accelerating into an upward spike.
Medium Term: An upward spike is identified by strong rallies and short retracements/consolidations lasting only a few days.
The Big Picture: Expect further gains if crude oil remains above $70/barrel.
Light Crude has pulled back to test the new $70 support level. A successful test would be a strong bull signal for gold and oil prices; as would a close above the recent high of $75/barrel. A close below $70 on the other hand would indicate a lack of commitment from buyers.
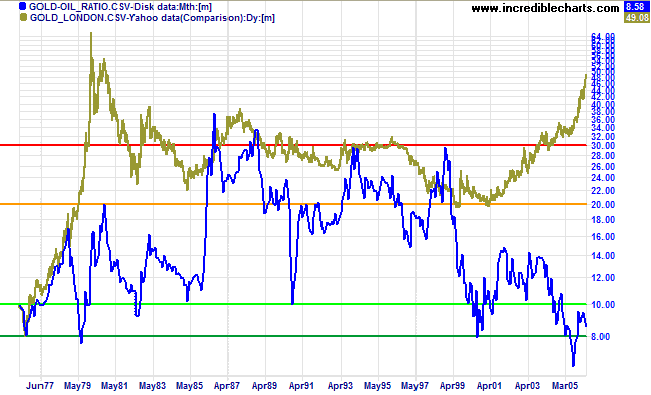
The gold-oil ratio is below 9, indicating that the gold price is low relative to oil. An up-turn below 10 normally signals a good buying opportunity.
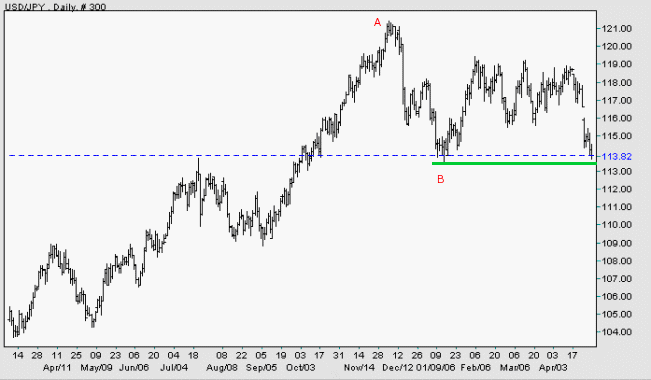
The dollar is weakening against major trading partners.
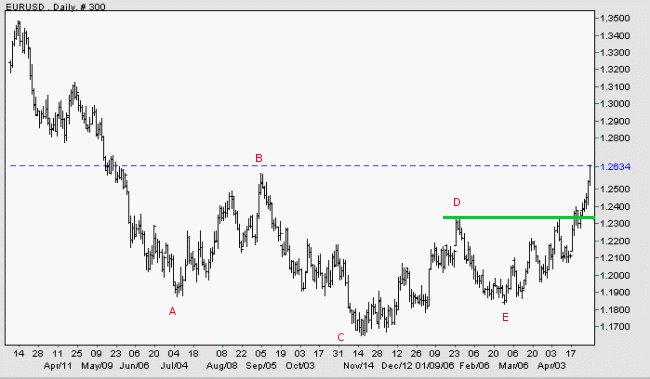
EUR/USD: The euro broke through resistance at [D] to commence a primary up-trend against the dollar; confirmed by the rise above 1.24 after a short pull-back. This also completes an inverted head and shoulders at [A] to [E].
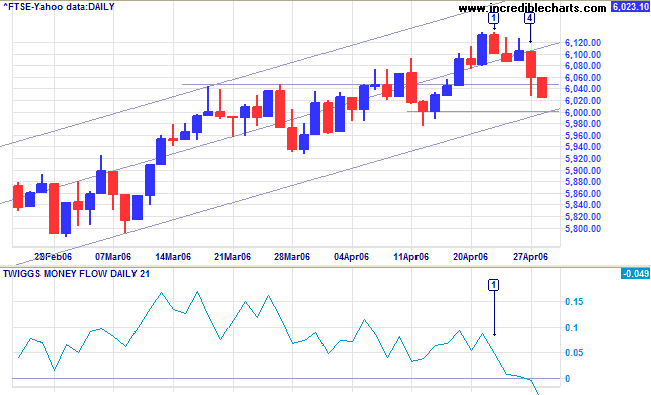
The FTSE 100 is headed for a test of 6000 after overcoming support at 6050 (indicated by a long tail and increased volume at [4]).
Medium Term: Twiggs Money Flow (21-day) fell sharply to end the week below zero, signaling distribution. A successful test of support at 6000 would be a positive sign, while a close below this level would signal the start of a secondary correction.
The Big Picture: The FTSE 100 continues in a strong primary up-trend.
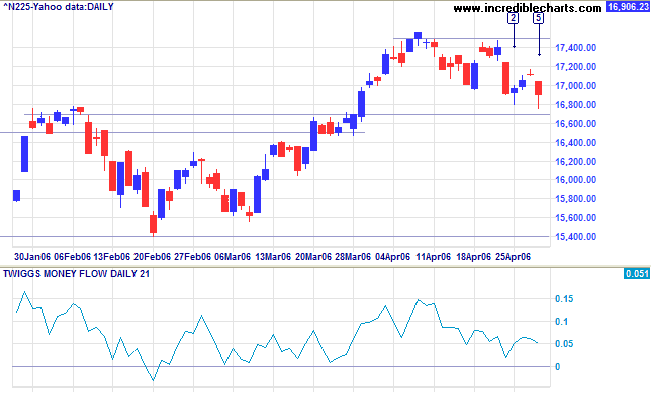
The Nikkei 225 retraced to test support at 16700/16800, but long tails at [2] and [5] confirm the presence of buyers.
Medium Term: Twiggs Money Flow (21-day) declined somewhat in recent weeks, but still holds above zero, signaling long term accumulation. A break above 17500 would signal a rally to test the target of 17900 (16700 + (16700 - 15500)), while a fall below 16700 would mean a secondary correction.
The Big Picture: The primary up-trend continues.
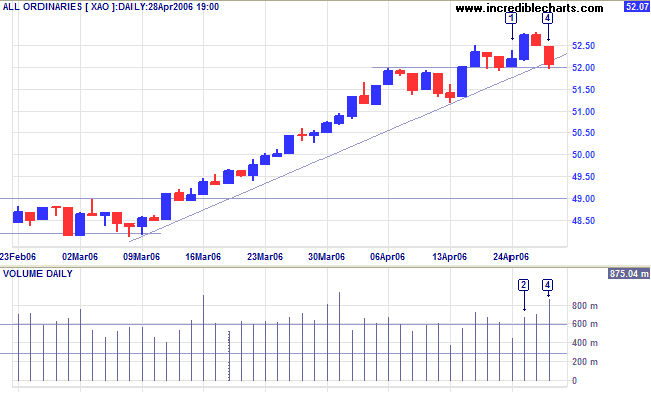
The All Ordinaries is making marginal breaks above previous highs before retreating to test support. Wednesday [2] saw a break through resistance at 5250 only to encounter further selling; leading to another test of support at 5200. Resistance is evident from the strong volume at [2] and [3], and buying support from the exceptional volume at [4]. Frequent red candles over the past 3 weeks are another sign of increased resistance. If support at 5200 holds we are likely to see another test of resistance at 5280, the high of [2], and further consolidation. If support fails, however, that could signal the start of a secondary correction; confirmed if there is a fall below the April 13 low of 5120.
Regards,
if it looks good to the world but does not feel good in your heart,
it is not success at all.
~ Anna Quindlen

Author: Colin Twiggs is a former investment banker with almost 40 years of experience in financial markets. He co-founded Incredible Charts and writes the popular Trading Diary and Patient Investor newsletters.
Using a top-down approach, Colin identifies key macro trends in the global economy before evaluating selected opportunities using a combination of fundamental and technical analysis.
Focusing on interest rates and financial market liquidity as primary drivers of the economic cycle, he warned of the 2008/2009 and 2020 bear markets well ahead of actual events.
He founded PVT Capital (AFSL No. 546090) in May 2023, which offers investment strategy and advice to wholesale clients.