Trading Diary
April 22, 2006
These extracts from my daily trading diary are
for educational purposes and should not be interpreted as
investment advice. Full terms and conditions can be found at
Terms
of Use.
USA
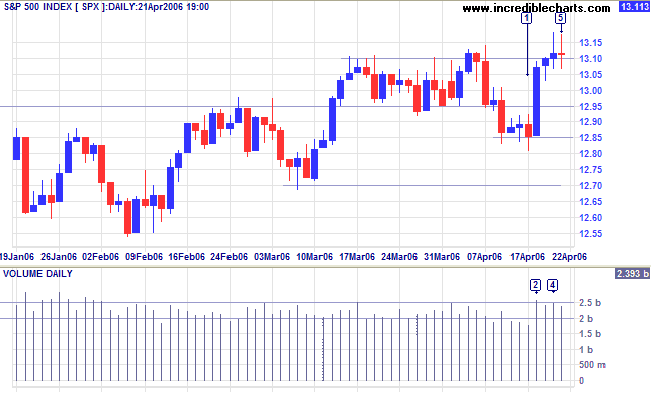
The S&P 500 posted a strong blue candle with increased volume at [2] despite crude oil breaking through the $70 barrier, but immediately thereafter encountered resistance at 1310, with strong volume at [4] and tall shadows at [4] and [5]. A fall below the low of [5] would signal a test of support at 1285, while a rise above the high of [5] would signal resumption of the up-trend.
The S&P 500 posted a strong blue candle with increased volume at [2] despite crude oil breaking through the $70 barrier, but immediately thereafter encountered resistance at 1310, with strong volume at [4] and tall shadows at [4] and [5]. A fall below the low of [5] would signal a test of support at 1285, while a rise above the high of [5] would signal resumption of the up-trend.
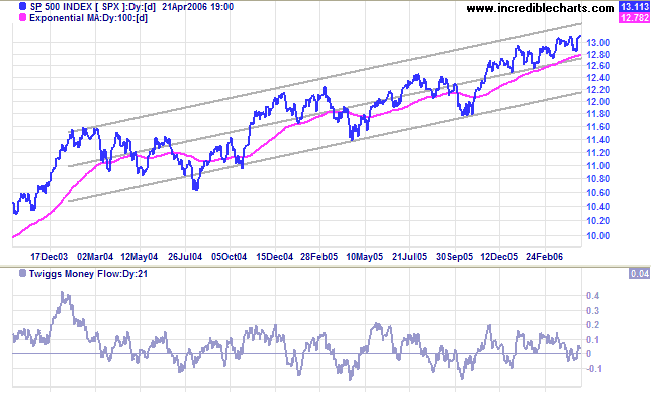
Medium Term: The index is edging upwards in a narrow band
above the 2-year linear regression line. Parallel channel lines
are fitted at 2 standard deviations around the linear regression
line. A close below the center line would signal a secondary
correction, testing support at the lower edge of the channel,
while a break above the upper channel would signal that the trend
is accelerating.
Twiggs Money Flow (21-day) whipsawing around zero signals
uncertainty.
Long Term: The index is in a slow up-trend, with primary support at 1180.
Long Term: The index is in a slow up-trend, with primary support at 1180.
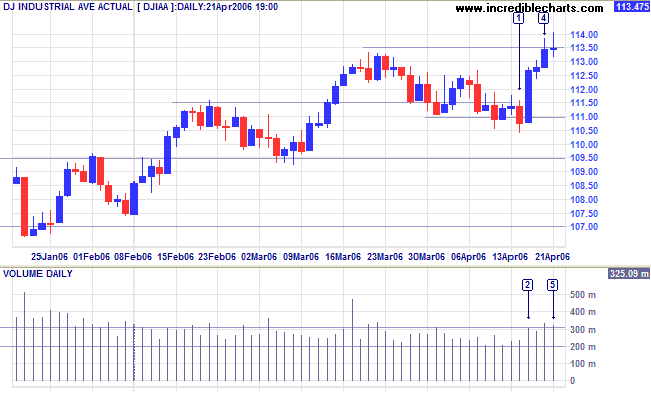
The Dow Industrial Average respected support at 11100 with
a strong blue candle at [2] despite crude
oil making new highs. However, long shadows and strong volume
at [4] and [5] signal strong resistance at the March high.
Medium Term: Twiggs Money Flow (21-day) is whipsawing around the zero line, signaling uncertainty. This suggests that another test of 11100 is likely.
Long Term: The primary up-trend is confirmed, while Dow Theory signals a bull market with both Industrial and Transport Averages in primary up-trends.
- A breakout above 11350 would be a bull signal;
- Consolidation in a narrow band below resistance would still be bullish;
- A successful test of support at 11100 would also mean longer-term strength;
- While a fall below 11100 would indicate the start of a secondary correction.
Medium Term: Twiggs Money Flow (21-day) is whipsawing around the zero line, signaling uncertainty. This suggests that another test of 11100 is likely.
Long Term: The primary up-trend is confirmed, while Dow Theory signals a bull market with both Industrial and Transport Averages in primary up-trends.
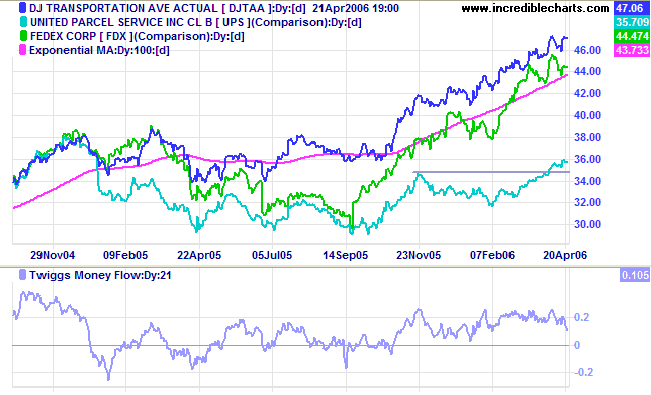
The Dow Jones Transportation Average and lead indicators,
Fedex and UPS, all signal primary up-trends.
Twiggs Money Flow (21-day) has held above zero for more than
5 months, signaling strong accumulation. The three bullish
indicators in unison are a strong positive signal for the
economy.
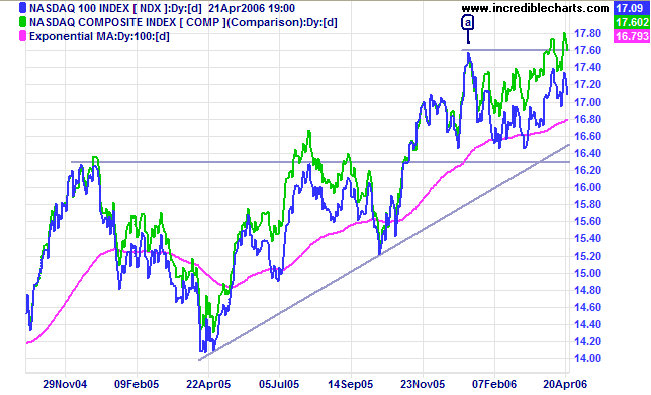
The Nasdaq 100 is consolidating between 1630 and 1760.
While the broader Nasdaq Composite broke above its January
high, the NDX 100 is edging slowly upward to test resistance at
1760.
Twiggs Money Flow (21-day), on the other hand, has edged
below zero, signaling distribution; so watch for retracement to
test the 1630 support level.
Treasury yields
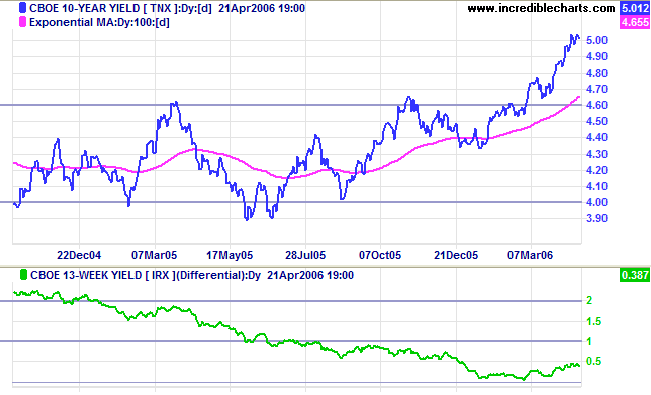
The 10-Year treasury yield pulled back to successfully test support at 5%.
Medium Term: Chairman Bernanke's testimony on the 27th before the Joint Economic Committee of Congress may give some clues as to Fed policy, but at present the market is pricing in at least one more rate increase. The buoyant property market should not be significantly harmed by the latest rise in long-term yields because rates are still historically low; while banks will benefit from wider margins from the steeper yield curve.
Long Term: The yield differential (10-year T-notes minus 13-week T-bills) is trending upwards, allowing the Fed more leeway to increase interest rates.
Wright's
Model: Developed recently by Fed economist Jonathan H
Wright, the model combines the yield differential and fed funds
rate to calculate the probability of recession. Looking ahead at
the next four quarters, the probability remains at
a reasonably low 23%.
The Big Picture: Transport indicators signal
increasing economic activity, while equity markets edge
cautiously upwards.
Dow Theory indicates a bull market, but recent hikes in crude
oil prices are weighing the market down. Long and short-term
rates are likely to continue rising for the next few months,
without causing significant harm to the economy because levels
are still historically low. The improving
yield differential is a positive sign, allaying fears of an
economic downturn, and signs are good for a growing economy over
the next four quarters.
Gold
Spurred by higher oil prices, spot gold broke out of the narrow consolidation below $600, climbing sharply to close at $632.50.
Medium Term: A rise above the Thursday high of $645 will signal another strong rally. While a close below the short-term low of $610 will signal a test of the new support level at $600.
The Big Picture: We can expect strong gains over the next few weeks if crude oil remains above $70/barrel.
Gold's previous high of $850 was experienced during the 1980 Iran/Iraq crisis -- when crude oil climbed to $38/barrel. Adjusting 1980 prices for inflation, an identical crisis today would see oil at $100/barrel and gold reach $2000!
Crude Oil
Light Crude gapped through resistance at $70, to close above $75/barrel: a strong bull signal for oil (and gold) prices.
Light Crude gapped through resistance at $70, to close above $75/barrel: a strong bull signal for oil (and gold) prices.
Currencies
The dollar is starting to weaken against major trading partners.
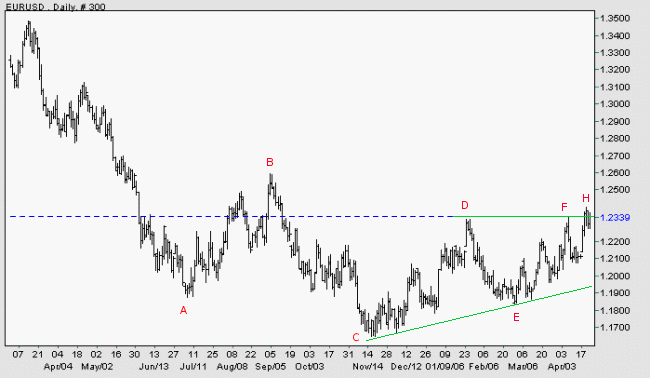
EUR/USD: The euro has broken through resistance at [D] and [F] to commence a primary up-trend against the dollar. This will be confirmed if there is a rise above the high of [H]. Failure to confirm, on the other hand, may lead to a test of support at [E].
The dollar is starting to weaken against major trading partners.
EUR/USD: The euro has broken through resistance at [D] and [F] to commence a primary up-trend against the dollar. This will be confirmed if there is a rise above the high of [H]. Failure to confirm, on the other hand, may lead to a test of support at [E].
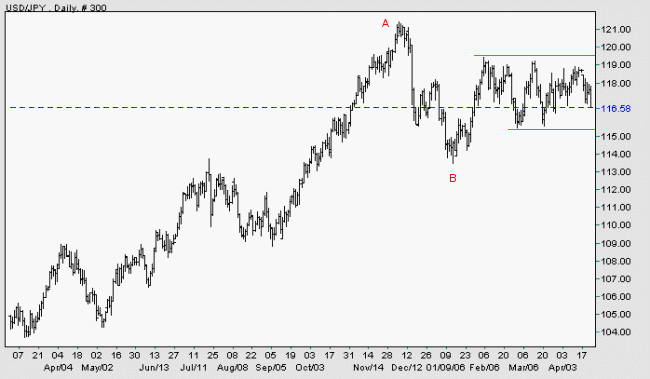
USD/JPY: The dollar continues to consolidate in a narrow band
against the yen. A break above resistance would be a bullish
sign, while a fall through support would be bearish. In the
long-term, a rise above [A] would signal continuation of the
primary up-trend, while a fall below [B] would signal a reversal.
Source: Netdania
United Kingdom
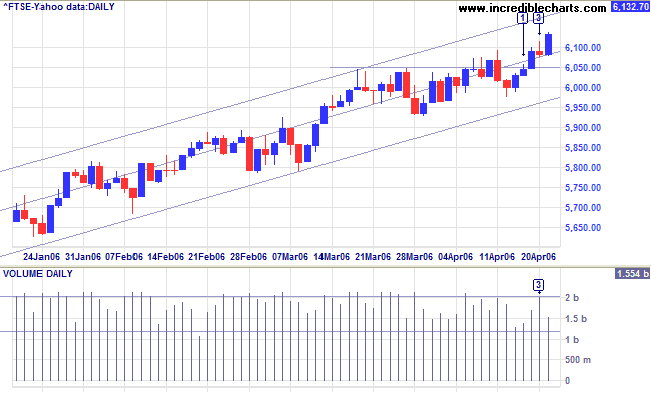
The FTSE 100 broke through resistance at 6050 at [2] before encountering further resistance at [3], indicated by a tall shadow and increased volume. This was overcome by another strong blue candle on Friday [4] and we can expect the rally to test the upper border of the linear regression channel.
Medium Term: Twiggs Money Flow (21-day) completed a higher low, suggesting short-term accumulation. A successful test of the new 6050 support level would add strength to the rally.
The Big Picture: The FTSE 100 continues a strong primary up-trend.
Japan
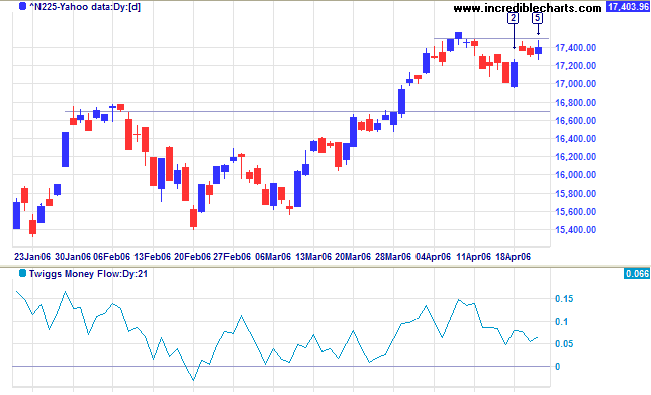
The Nikkei 225 has consolidated for three days in a narrow range below resistance at 17500, a bullish sign.
Medium Term: Twiggs Money Flow (21-day) is forming lows well above zero, signaling accumulation. The target for the breakout, 17900 (16700 + (16700 - 15500)), is likely to be reached sooner rather than later.
The Big Picture: The index is in a strong primary up-trend after establishing a base above 15000.
ASX Australia
The All Ordinaries encountered resistance at 5250, with strong volume evident at [2]. Buying support is close behind, however, with a long tail at [3] and high volumes at [3] and [4]. Expect another short consolidation/retracement. The last rally (between consolidations/retracements) is shorter than earlier rallies, indicating that the index may be approaching a secondary top.
The All Ordinaries encountered resistance at 5250, with strong volume evident at [2]. Buying support is close behind, however, with a long tail at [3] and high volumes at [3] and [4]. Expect another short consolidation/retracement. The last rally (between consolidations/retracements) is shorter than earlier rallies, indicating that the index may be approaching a secondary top.
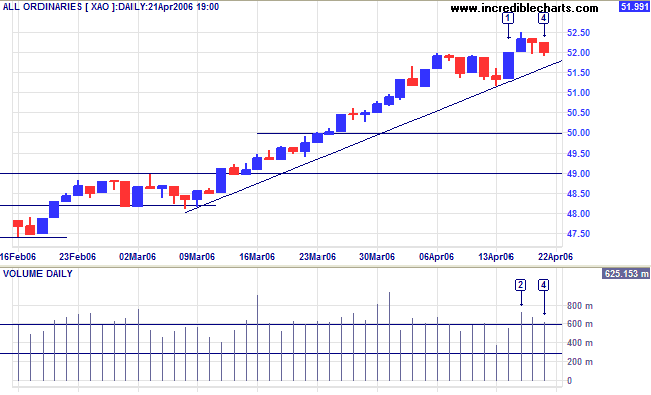
Medium Term:
Twiggs Money Flow (21-day) is rising (medium term), signaling
accumulation. The short-term divergence, however, suggests
weakness. The trend is above the upper border of the linear
regression channel, signaling acceleration (especially as this is
a log scale). Accelerating trends make rapid gains, but often
blow-off into a sharp reversal as the index retreats to the
safety of the previous base (either 4750 or 4300).
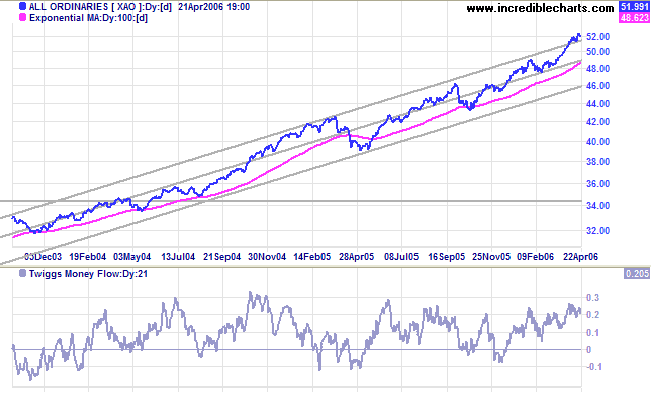
The Big Picture: The primary up-trend is accelerating.
For further background information, read About
the Trading Diary.
Regards,
Regards,
Colin Twiggs
It isn't as important to buy as cheap as possible
as it is to buy at the right time.
~ Jesse Livermore
as it is to buy at the right time.
~ Jesse Livermore

Author: Colin Twiggs is a former investment banker with almost 40 years of experience in financial markets. He co-founded Incredible Charts and writes the popular Trading Diary and Patient Investor newsletters.
Using a top-down approach, Colin identifies key macro trends in the global economy before evaluating selected opportunities using a combination of fundamental and technical analysis.
Focusing on interest rates and financial market liquidity as primary drivers of the economic cycle, he warned of the 2008/2009 and 2020 bear markets well ahead of actual events.
He founded PVT Capital (AFSL No. 546090) in May 2023, which offers investment strategy and advice to wholesale clients.