Trading Diary
April 8, 2006
These extracts from my daily trading diary are
for educational purposes and should not be interpreted as
investment advice. Full terms and conditions can be found at
Terms
of Use.
USA
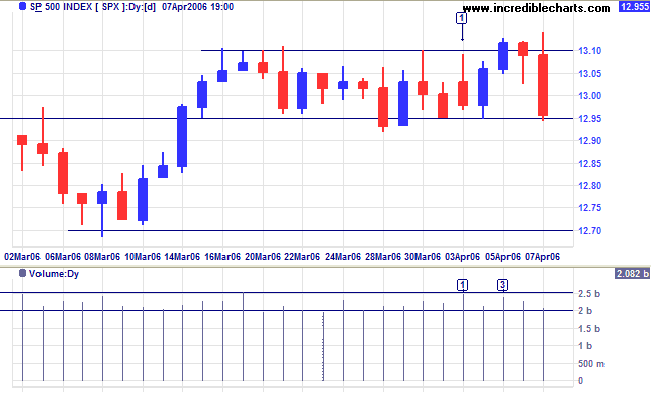
The S&P 500 is consolidating between 1295 and 1310, with resistance evident from strong volumes at [1] and [3]. A fall below support would signal a test of 1270, while a close above 1310 would signal resumption of the primary up-trend.
The first quarter has ended and we need to remain alert for a secondary correction -- at least for the next week.
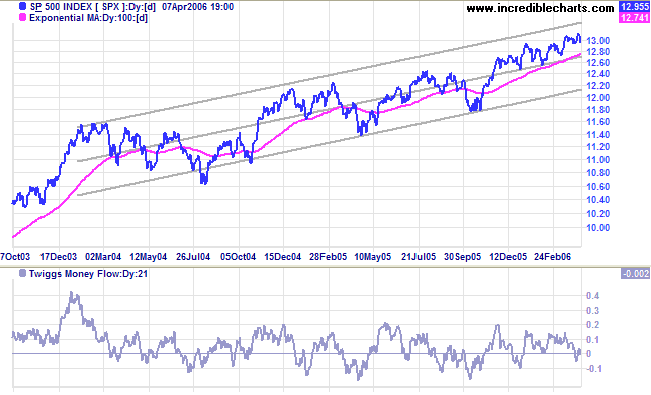
Medium Term: A 2-year standard deviation channel (parallel
lines fitted at 2 standard deviations around a linear regression
line) highlights recent trend behavior, the index edging upwards
in a narrow band above the center line. A close below the center
line would signal a test of support at the lower edge of the
channel.
Twiggs Money Flow at zero warns of distribution.
Long Term: The index is in a slow up-trend, with primary support at 1180.
Long Term: The index is in a slow up-trend, with primary support at 1180.
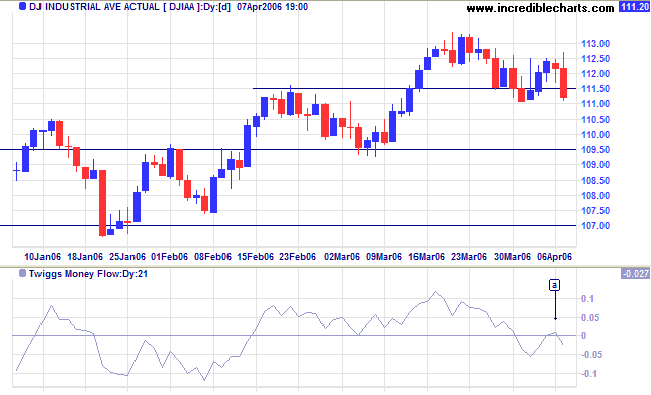
The Dow Industrial Average is testing support at 11100.
After the lower high, expect a test of (intermediate) support at
10950. However, if short-term support at 11100 holds, that would
signal a stronger up-trend.
Medium Term: A close below 10950 would warn of a secondary correction, testing support at 10000. Twiggs Money Flow (21-day) is bearish, having completed a peak below zero at [a].
Long Term: If the index respects support at 10950, the primary up-trend is confirmed.
Medium Term: A close below 10950 would warn of a secondary correction, testing support at 10000. Twiggs Money Flow (21-day) is bearish, having completed a peak below zero at [a].
Long Term: If the index respects support at 10950, the primary up-trend is confirmed.
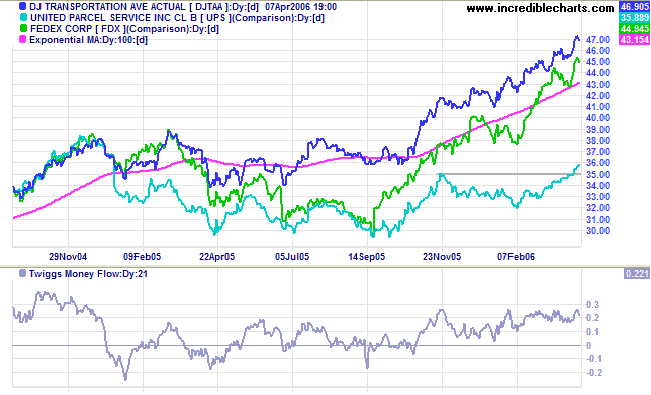
Lead indicator UPS has joined Fedex and the Dow Jones
Transportation Average in signaling strong primary up-trends.
The strength of the DJTAA up-trend is best illustrated by Twiggs
Money Flow (21-Day) which has not crossed below zero in more than
5 months. Three bullish indicators in unison are a strong
positive signal for the economy.
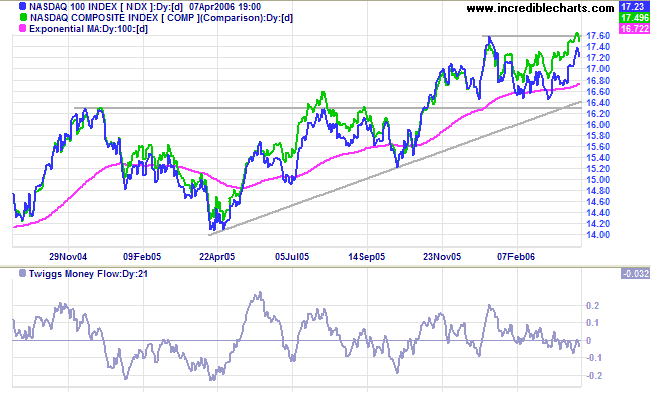
The Nasdaq 100 is headed for a test of resistance at 1760,
but is expected to follow the broader Nasdaq Composite
which is already above its January high, signaling resumption of
the primary up-trend.
Twiggs Money Flow (21-day) has edged below zero, warning us
to exercise caution.
Treasury yields
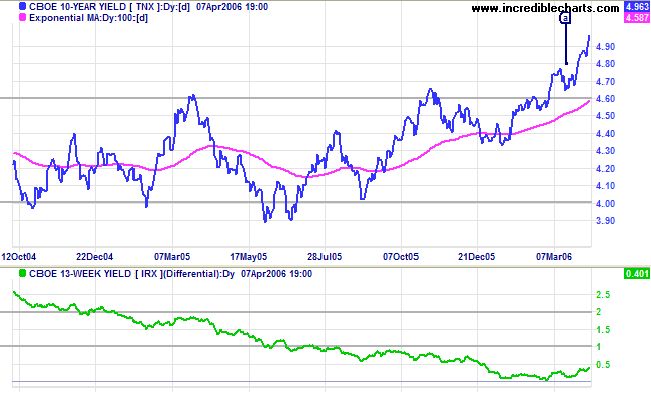
The 10-Year treasury yield is rallying strongly on the back of low unemployment figures which have increased expectations of future rates hikes.
Medium Term: The Fed is expected to continue hiking the short-term funds rate, in turn causing long-term yields to rise. The buoyant property market should not be significantly harmed by the historically low long-term yields, while banks will benefit from wider margins caused by the steeper yield curve.
Long Term: The yield differential (10-year T-notes minus 13-week T-bills) is trending upwards, easing the credit squeeze and, if this continues, allowing the Fed more leeway to increase interest rates.
The Big Picture: Transport indicators signal increasing
economic activity, while equity markets are edging cautiously
upwards. Expect rate hikes to continue for the next few months
and long-term yields to rise, without causing significant harm to
the economy because of the historically low base. There are no
signs as yet, but we need to be on the alert for an upturn in
major equity indexes in the next few months.
Gold
Spot gold closed at $587.80 after testing resistance at $600 earlier in the week.
Medium Term: A narrow consolidation below $600 would be a bullish sign, while a fall below $575 would signal a secondary correction.
The Big Picture: Gold has resumed its primary up-trend.
Spot gold closed at $587.80 after testing resistance at $600 earlier in the week.
Medium Term: A narrow consolidation below $600 would be a bullish sign, while a fall below $575 would signal a secondary correction.
The Big Picture: Gold has resumed its primary up-trend.
Crude Oil
Light Crude closed at $67.39 a barrel and appears headed for a test of resistance at $70. A rise above $70 would be a strong bull signal for oil (and gold) prices, while a drop below $55 would signal a primary trend reversal.
Light Crude closed at $67.39 a barrel and appears headed for a test of resistance at $70. A rise above $70 would be a strong bull signal for oil (and gold) prices, while a drop below $55 would signal a primary trend reversal.
Currencies
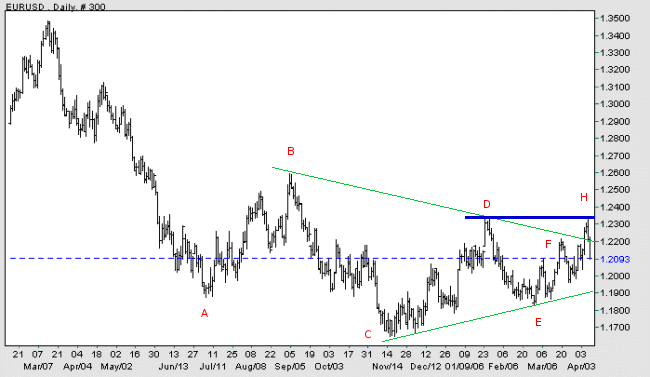
The dollar is consolidating in a narrowing range against major trading partners.
EUR/USD: The euro is in an intermediate up-trend and threatens a primary trend reversal after the recent bullish breakout from a large triangle. A rise above the high of [D] would signal that the euro has started a primary up-trend against the dollar, while a fall below [E] would mean continuation of the down-trend.
USD/JPY: The dollar continues to consolidate in a narrow band
against the yen. A break above resistance at [C] would be a
bullish sign, while a fall below support at [F] would be bearish.
In the long-term, a rise above [A] would signal continuation of
the primary up-trend, while a fall below [B] would signal a
reversal.
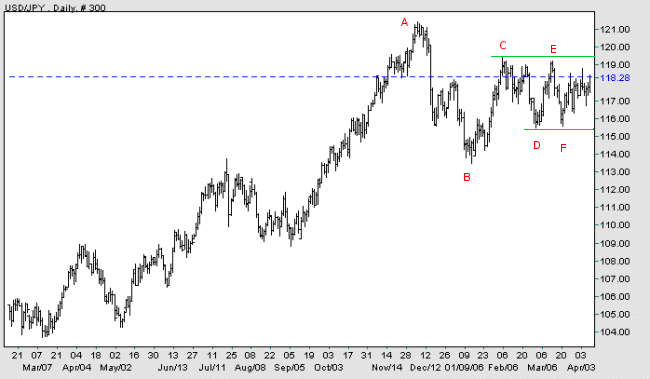
Source: Netdania
United Kingdom
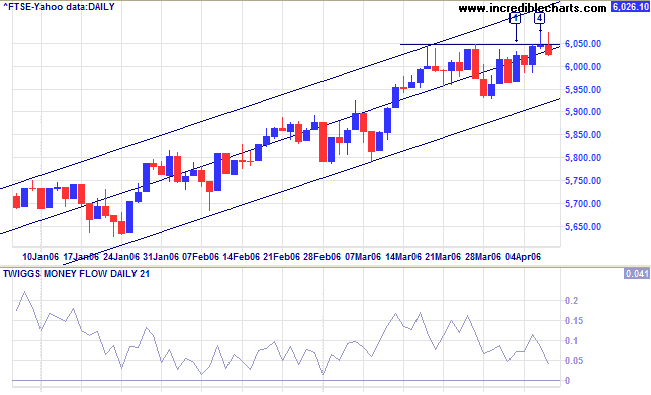
The FTSE 100 is encountering stubborn resistance at 6050, with increased volume at [3] and long shadows at [4] and [5].
Medium Term: Twiggs Money Flow (21-day) is declining, showing short-term distribution. A close below support at 5930 (also the lower border of the linear regression channel) would warn of a secondary correction, while a close above 6050 would signal continuation of the up-trend.
The Big Picture: The FTSE 100 is in a strong primary up-trend.
Japan
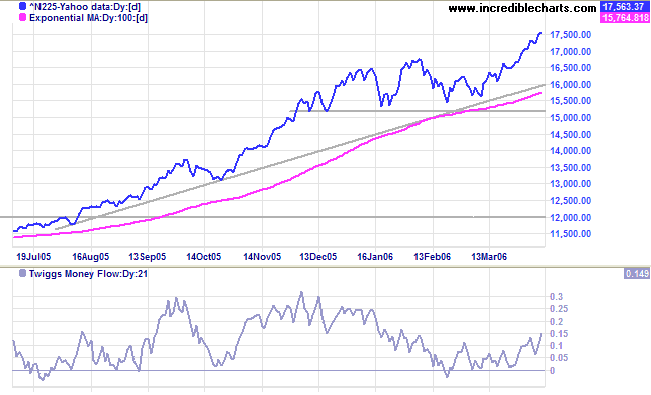
The Nikkei 225 is rallying strongly, up almost 1000 points from the breakout.
Medium Term: Twiggs Money Flow (21-day) is rising steadily, signaling accumulation. The target for the breakout, 17900 (16700 - (16700 - 15500)), is likely to be reached sooner rather than later.
The Big Picture: The index has resumed a strong primary up-trend after establishing a base above 15000.
ASX Australia
The market is entering a state of euphoria with the All Ordinaries making new highs. Retracements are exceedingly short with resistance at [2] and [4] quickly overcome by buying pressure.
The market is entering a state of euphoria with the All Ordinaries making new highs. Retracements are exceedingly short with resistance at [2] and [4] quickly overcome by buying pressure.
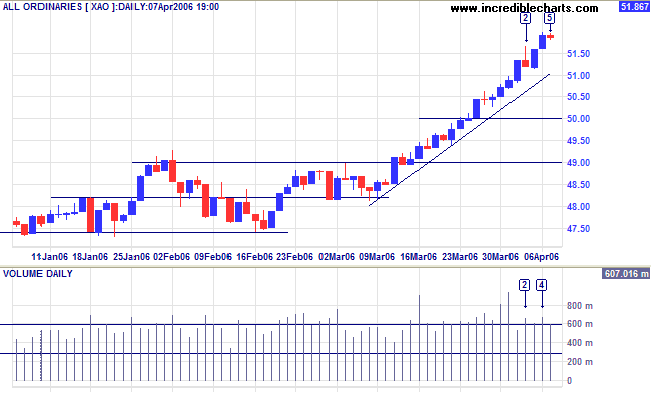
Medium Term:
Twiggs Money Flow (21-day) continues to rise above the zero,
signaling strong accumulation. The trend has exceeded its target
of 5050 (4900 + (4900 - 4750)) and is accelerating into a
blow-off, having broken through the upper border of the linear
regression channel. A blow-off makes rapid gains, but is often
followed by a sharp reversal as the index retreats to the safety
of the previous base (around 4900).
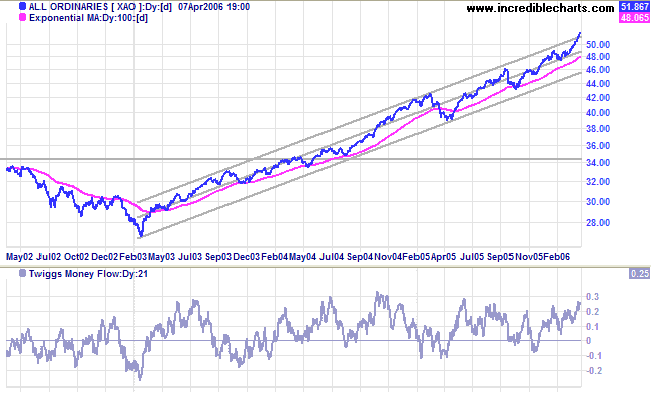
The Big Picture: The primary up-trend is rapidly
accelerating -- hence today's cautionary quote from George Soros.
For further background information, read About
the Trading Diary.
Regards,
Regards,
Colin Twiggs
The usual bull market successfully weathers a number of tests
until it is considered invulnerable,
whereupon it is ripe for a bust.
~ George Soros
whereupon it is ripe for a bust.
~ George Soros

Author: Colin Twiggs is a former investment banker with almost 40 years of experience in financial markets. He co-founded Incredible Charts and writes the popular Trading Diary and Patient Investor newsletters.
Using a top-down approach, Colin identifies key macro trends in the global economy before evaluating selected opportunities using a combination of fundamental and technical analysis.
Focusing on interest rates and financial market liquidity as primary drivers of the economic cycle, he warned of the 2008/2009 and 2020 bear markets well ahead of actual events.
He founded PVT Capital (AFSL No. 546090) in May 2023, which offers investment strategy and advice to wholesale clients.