Trading Diary
April 1, 2006
These extracts from my daily trading diary are
for educational purposes and should not be interpreted as
investment advice. Full terms and conditions can be found at
Terms
of Use.
USA
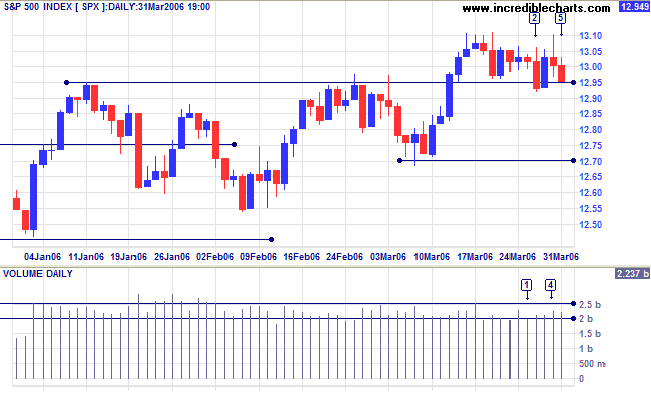
The S&P 500 briefly penetrated the new support level at 1295 before recovering. A false downward break would normally be seen as a bullish sign, but the intervening rallies are weak, placing doubt over the strength of short-term support. Expect the index to test intermediate support at 1270, while a close above 1310, though unlikely at this stage, would signal resumption of the primary up-trend.
The first quarter has ended and we need to be on the alert for a secondary correction -- as institutional positions taken to support prices prior to the quarter end are unwound.
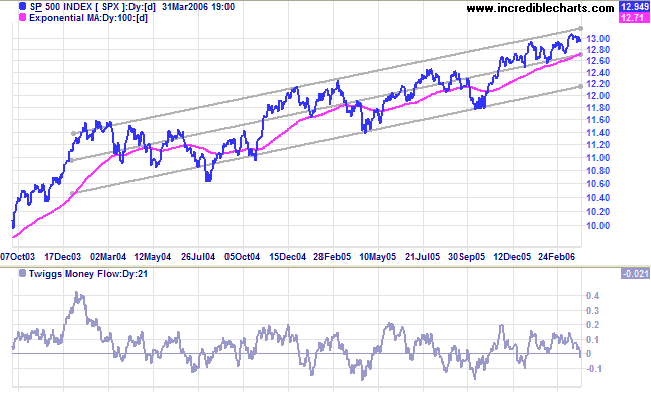
Medium Term: The linear regression channel on the chart
below depicts the pace of the up-trend in recent years (new
drawing tools will be released with the beta version in early
April). The index is advancing in a slow up-trend, frequently
retracing to test previous support levels. A close below the
central linear regression line would signal a test of support at
the lower channel line.
Twiggs Money Flow closed below zero, warning of
distribution.
Long Term: The index is in a slow up-trend, with primary support at 1180.
Long Term: The index is in a slow up-trend, with primary support at 1180.
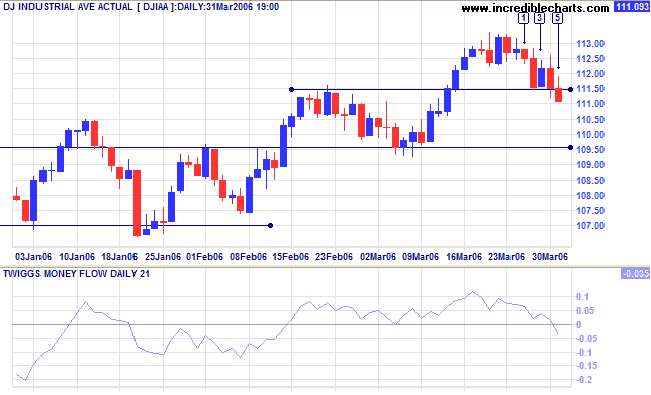
The Dow Industrial Average retraced to test support at
11150, but the short pull-back at [3] signaled weakness and was
followed by a bearish close below support at [5]. Expect a test
of support at 10950.
Medium Term: Twiggs Money Flow (21-day) has turned below zero, warning of distribution. A close below 10950 would warn of a secondary correction, testing support at 10000.
Long Term: If the index respects support at 10950, the primary up-trend is confirmed.
Medium Term: Twiggs Money Flow (21-day) has turned below zero, warning of distribution. A close below 10950 would warn of a secondary correction, testing support at 10000.
Long Term: If the index respects support at 10950, the primary up-trend is confirmed.
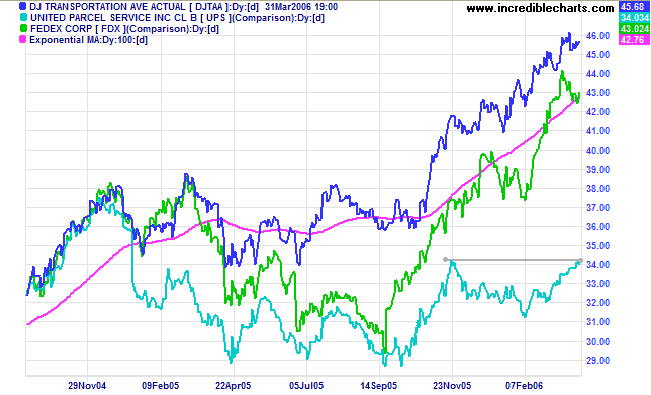
The Dow Jones Transportation Average and lead indicator
Fedex are in strong primary up-trends. UPS is testing its
November high; a breakout would signal resumption of the primary
up-trend, while a failure to do so would mean another test of
support at the February low. Three bullish indicators in unison
would be a strong positive signal for the economy.
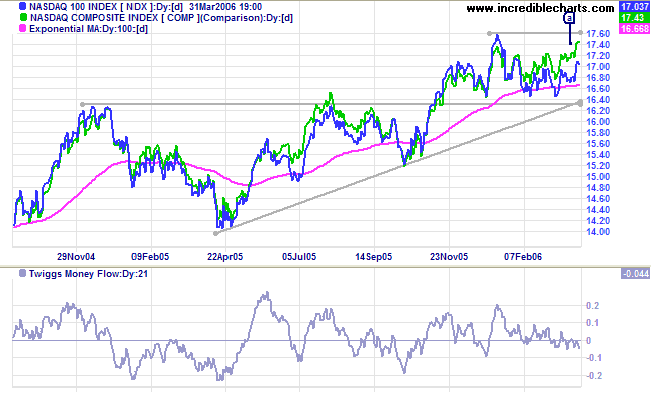
The Nasdaq 100 and the broader Nasdaq Composite
both started an intermediate up-trend, with higher lows at [a]
followed by higher highs, but
Twiggs Money Flow (21-day) is below zero, warning us to
exercise caution.
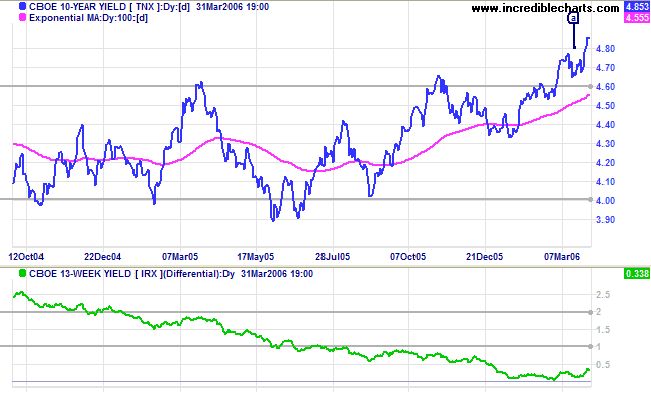
Treasury yields
The 10-Year treasury yield respected support at 4.60/4.65% before rallying sharply to 4.85% -- after the new Fed Chairman showed that he is likely to be tough on inflation. The breakout confirms the first real up-trend in long-term yields in almost 3 years.
Medium Term: The Fed is expected to make at least one more rate increase this year, lifting the short-term funds rate to 5.0%. The buoyant property market is likely to slow, but banks will benefit from wider margins caused by the steeper yield curve -- so long as rates do not run high enough to affect loan defaults.
Long Term: The yield differential (10-year T-notes minus 13-week T-bills) has started to trend upwards, easing the credit squeeze.
The Big Picture: Transport indicators indicate an increase
in economic activity, while equity markets are edging upwards.
Rising long-term treasury yields may cause a slow-down in the
property market, but are necessary to keep the economy on a sound
footing.
Gold
Spot gold closed at $581.50 after breaking through resistance at $575 earlier in the week.
Medium Term: Expect a test of the new support level at $570/$575.
The Big Picture: A successful test of support will confirm that gold has resumed its primary up-trend.
Spot gold closed at $581.50 after breaking through resistance at $575 earlier in the week.
Medium Term: Expect a test of the new support level at $570/$575.
The Big Picture: A successful test of support will confirm that gold has resumed its primary up-trend.
Crude Oil
Light Crude is above $66 dollars a barrel and appears headed for a test of resistance at $70. A rise above $70 would be a strong bull signal (for gold as well), while a fall below medium-term support at $58 would be bearish -- and a drop below $55 would indicate a primary trend reversal.
Light Crude is above $66 dollars a barrel and appears headed for a test of resistance at $70. A rise above $70 would be a strong bull signal (for gold as well), while a fall below medium-term support at $58 would be bearish -- and a drop below $55 would indicate a primary trend reversal.
Currencies
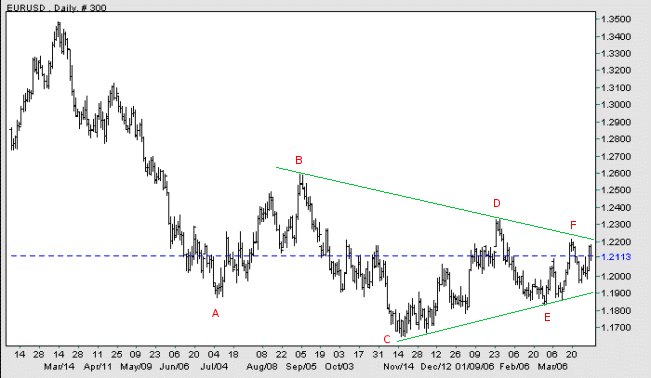
The dollar is consolidating in a narrowing range against major trading partners.
Medium Term:
EUR/USD: The euro has formed a large triangle against the dollar. A rise above [F] would indicate that the euro has started an up-trend, while a fall below [E] would signal that the primary down-trend will continue.
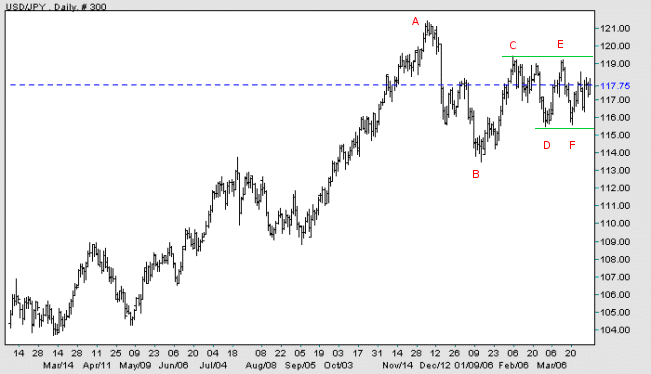
USD/JPY: The dollar is consolidating in a narrow band against the
yen. A break above resistance at [E] would be a bullish sign,
while a fall below support at [F] would be bearish.
Source: Netdania
The Big Picture:
EUR/USD: A break outside of the triangle would indicate the future direction of the primary trend.
USD/JPY: A rise above [A] would signal that the dollar has commenced a primary up-trend against the yen; a fall below [B] would signal the start of a primary down-trend.
EUR/USD: A break outside of the triangle would indicate the future direction of the primary trend.
USD/JPY: A rise above [A] would signal that the dollar has commenced a primary up-trend against the yen; a fall below [B] would signal the start of a primary down-trend.
United Kingdom
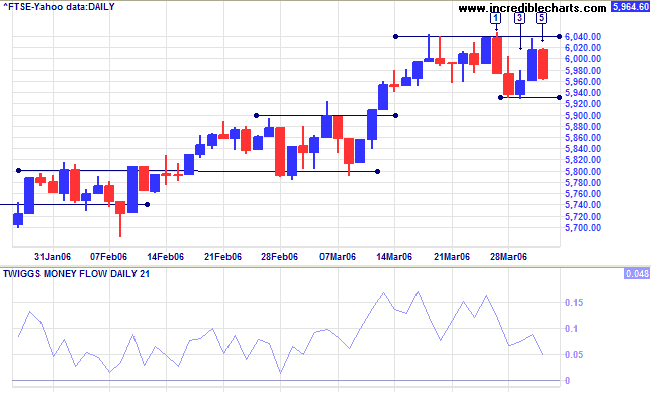
After the break through 6000, the FTSE 100 encountered resistance at the previous intra-day highs of 6040, retracing to test support at 5930. The subsequent rally ended with a weak close and the index appears headed for another test of support.
Medium Term: Twiggs Money Flow (21-day) is declining, showing short-term distribution. A close below support at 5930 would warn of a secondary correction, while a rise above 6040 would signal continuation of the up-trend.
The Big Picture: The FTSE 100 is in a strong primary up-trend.
Japan
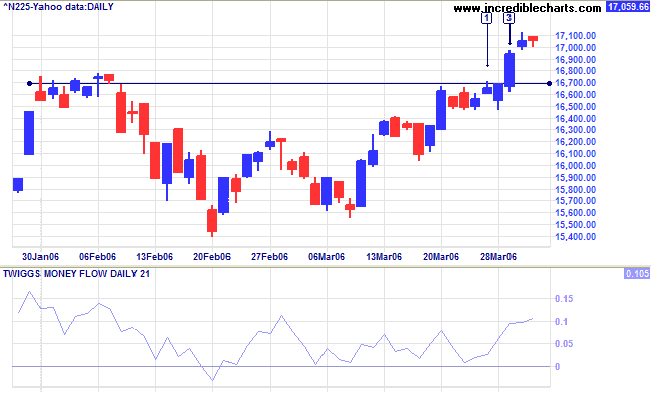
The Nikkei 225 broke through resistance at 16700. A retracement that respects the new support level would confirm the breakout.
Medium Term: Twiggs Money Flow (21-day) is rising above zero, signaling accumulation. The target for the breakout is 17900 (16700 - (16700 - 15500)).
The Big Picture: The index has resumed the primary up-trend after establishing a strong base for further gains.
ASX Australia
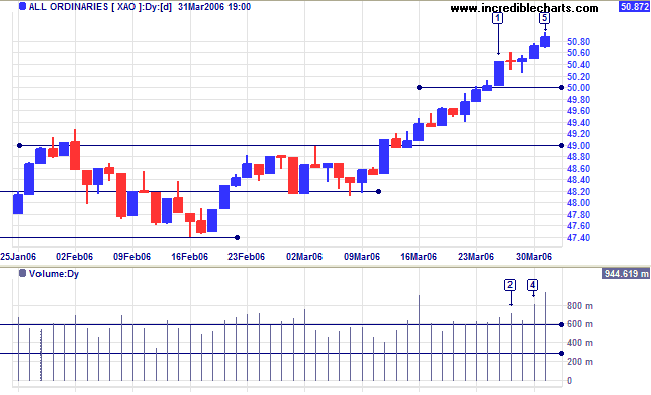
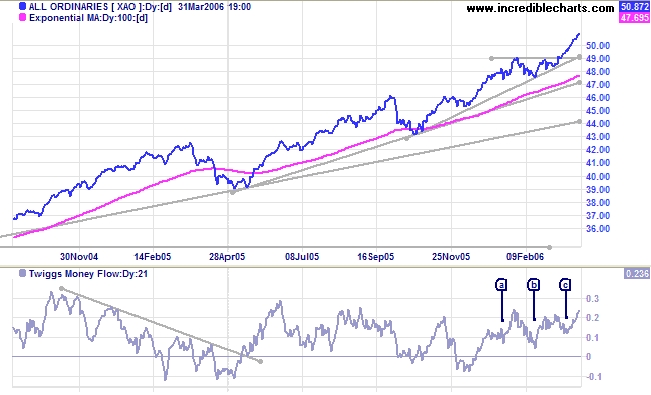
After a brief consolidation at 5000, the All Ordinaries rallied strongly to just below 5100. The short consolidation and strong volume at [2] and [3] indicates abnormal buying strength in the market. Exceptional volume at [4] and [5] indicate further resistance, but there is no retracement because of buying support. A break through resistance at 5100 would signal another strong rally. Though less likely, if resistance at 5100 holds we could see a retracement test the new support level at 5000.
After a brief consolidation at 5000, the All Ordinaries rallied strongly to just below 5100. The short consolidation and strong volume at [2] and [3] indicates abnormal buying strength in the market. Exceptional volume at [4] and [5] indicate further resistance, but there is no retracement because of buying support. A break through resistance at 5100 would signal another strong rally. Though less likely, if resistance at 5100 holds we could see a retracement test the new support level at 5000.
Medium Term:
Twiggs Money Flow (21-day) completed a higher trough [c]
above zero, signaling strong accumulation. The target of 5050
(4900 + (4900 - 4750)) has been exceeded, but the trend is
keeping its momentum.
The Big Picture: The primary up-trend is accelerating.
The Big Picture: The primary up-trend is accelerating.
For further background information, read About
the Trading Diary.
Regards,
Regards,
Colin Twiggs
Character isn't something you were born with and can't change,
like your fingerprints.
It's something you weren't born with and must take responsibility for forming.
~ Jim Rohn
It's something you weren't born with and must take responsibility for forming.
~ Jim Rohn

Author: Colin Twiggs is a former investment banker with almost 40 years of experience in financial markets. He co-founded Incredible Charts and writes the popular Trading Diary and Patient Investor newsletters.
Using a top-down approach, Colin identifies key macro trends in the global economy before evaluating selected opportunities using a combination of fundamental and technical analysis.
Focusing on interest rates and financial market liquidity as primary drivers of the economic cycle, he warned of the 2008/2009 and 2020 bear markets well ahead of actual events.
He founded PVT Capital (AFSL No. 546090) in May 2023, which offers investment strategy and advice to wholesale clients.