Trading Diary
March 25, 2006
These extracts from my daily trading diary are
for educational purposes and should not be interpreted as
investment advice. Full terms and conditions can be found at
Terms
of Use.
USA
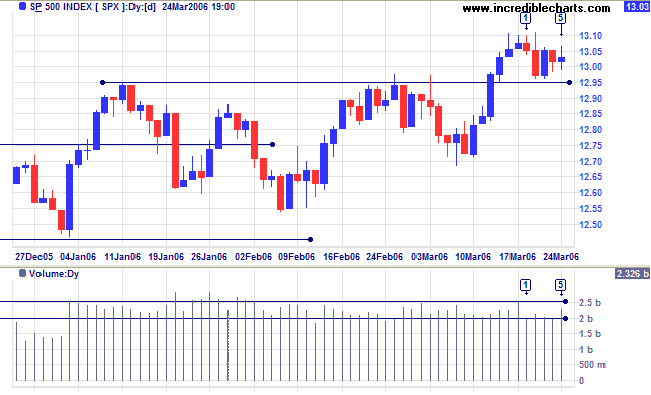
The S&P 500 retraced to test the new support level at 1295. Volumes are low and the doji candle at [5] signals hesitancy; another test of support is likely. A close below support would be bearish, while a close above 1310 or further consolidation would be bullish.
The S&P 500 retraced to test the new support level at 1295. Volumes are low and the doji candle at [5] signals hesitancy; another test of support is likely. A close below support would be bearish, while a close above 1310 or further consolidation would be bullish.
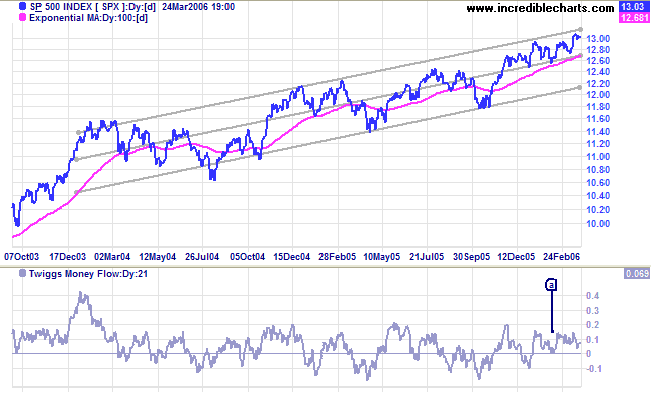
Medium Term: I have plotted a channel around a linear
regression line that depicts the pace of the up-trend in recent
years (new drawing tools will be released with the beta version
early next month). The index continues to advance in a slow
up-trend, frequently retracing to test previous support levels.
Twiggs Money Flow (above zero) signals accumulation, but this
appears insufficient to break out of the present pattern. We are
approaching the end of the first quarter, frequently followed by
a secondary correction, and need to be vigilant. A fall below the
regression line (or 100-day MA) would be a bear signal.
Long Term: The index is in a slow up-trend, with primary support at 1180.
Long Term: The index is in a slow up-trend, with primary support at 1180.
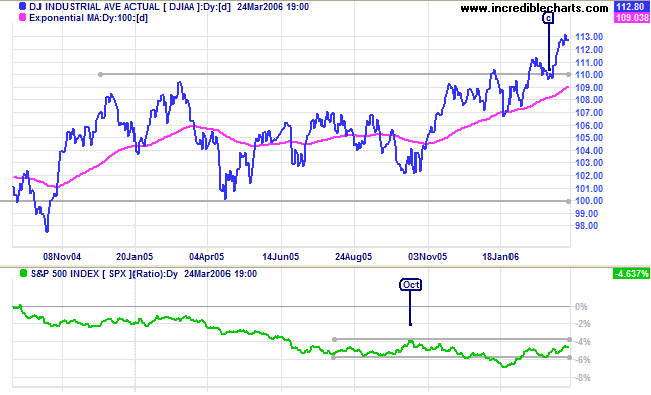
The Dow Industrial Average encountered short-term
resistance at 11320 and appears ready to test support at
11150.
Medium Term: The Dow is rallying strongly after the low of [c] confirmed support at the previous high of 11000. Twiggs Money Flow (21-day) is above zero, signaling accumulation.
Long Term: The Price Ratio below shows that the Dow has out-performed the S&P 500 over the past few weeks. A rise above the October high would indicate a flight to safety, with investors shifting to low-risk stocks.
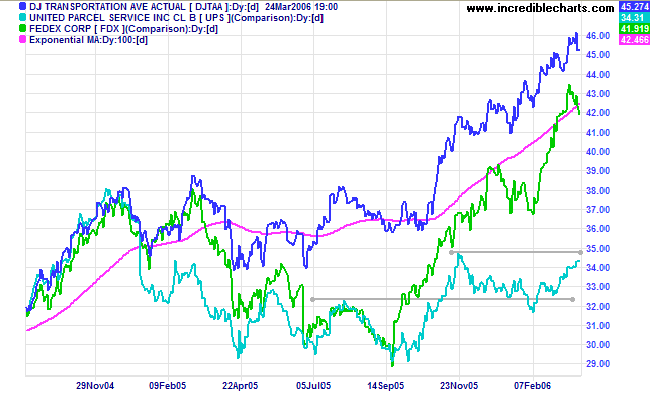
The Dow Jones Transportation Average and lead indicator
Fedex are in strong primary up-trends. UPS is headed for a test
of its November high and appears ready to join them. The three
indicators signal increased economic activity.
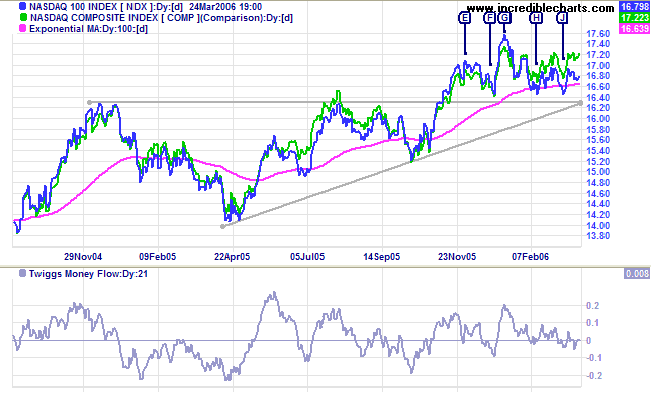
The Nasdaq 100 and the broader Nasdaq Composite
continue to show hesitancy, consolidating above support at 1630.
A rise above the high of [G] would be a bull signal, while a fall
below support would be a strong bear signal.
Twiggs Money Flow (21-day) whipsaws around the zero line,
signaling uncertainty.
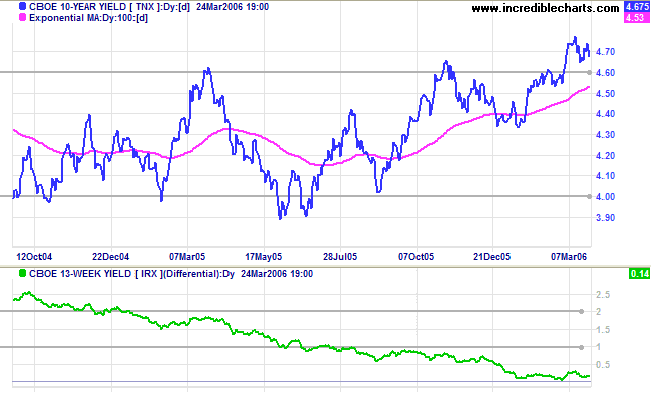
Treasury yields
The 10-Year treasury yield is retracing to test the new support level at 4.60/4.65%. A successful test would confirm the breakout.
Medium Term: The Fed is expected to make at least two more rate increases this year, lifting the short-term funds rate to 5.0%. The buoyant property market shows signs of slowing, but this may be a better option than an inverted yield curve -- the forerunner of most economic slow-downs.
Long Term: The yield differential (10-year T-notes minus 13-week T-bills) is close to zero, warning of declining bank margins and a likely credit squeeze.
The Big Picture: Transport indicators indicate an increase
in economic activity, while equity markets appear to be making
some progress. However, wage inflation, short-term interest
rates, and the flat yield curve are cause for concern and need to
be monitored closely.
Gold
Spot gold rose to $560.20, having completed a bullish higher low at [A].
Medium Term: Gold is consolidating between $535 and $575. Expect the current rally to test resistance at $570/$575.
The Big Picture: A break outside the consolidation range would signal the future direction of the primary trend.
Crude Oil
Light Crude rose to $64.26/barrel. A Light Crude or Brent Crude fall below medium-term support at $58 would be bearish, while a drop below $55 would indicate a primary trend reversal -- and a strong bear signal for gold. A rise above $70/barrel, on the other hand, would be bullish.
Light Crude rose to $64.26/barrel. A Light Crude or Brent Crude fall below medium-term support at $58 would be bearish, while a drop below $55 would indicate a primary trend reversal -- and a strong bear signal for gold. A rise above $70/barrel, on the other hand, would be bullish.
Currencies
The dollar is strengthening in the short-term against major trading partners.
Medium Term:
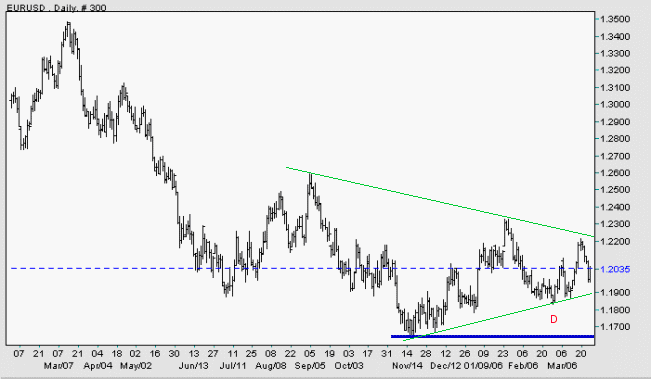
EUR/USD: The euro has formed a triangular pattern against the dollar; a breakout would signal the future direction of the trend. At present the currency is headed for a test of support at [D]; a fall below this level would be bearish.
The dollar is strengthening in the short-term against major trading partners.
Medium Term:
EUR/USD: The euro has formed a triangular pattern against the dollar; a breakout would signal the future direction of the trend. At present the currency is headed for a test of support at [D]; a fall below this level would be bearish.
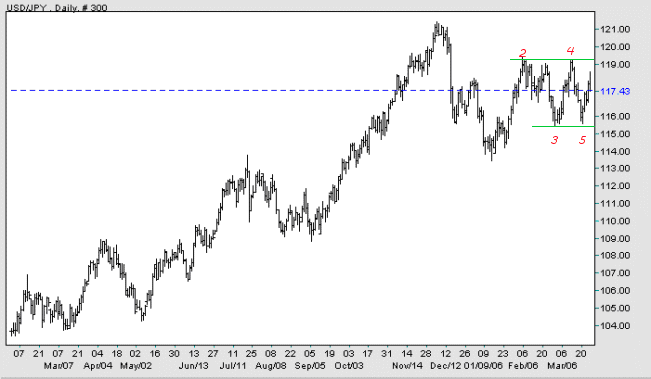
USD/JPY: The dollar is consolidating in a narrow band against the
yen. A break through resistance at [4] would be a bullish sign,
while a fall below support at [5] would be a strong bear signal.
Source: Netdania
The Big Picture:
EUR/USD: A fall below the November low would confirm that the euro is in a primary down-trend against the dollar; a rise above the January high would signal a reversal.
USD/JPY: A rise above the December high would signal that the dollar has commenced a primary up-trend against the yen; a fall below the January low would signal the start of a primary down-trend.
United Kingdom
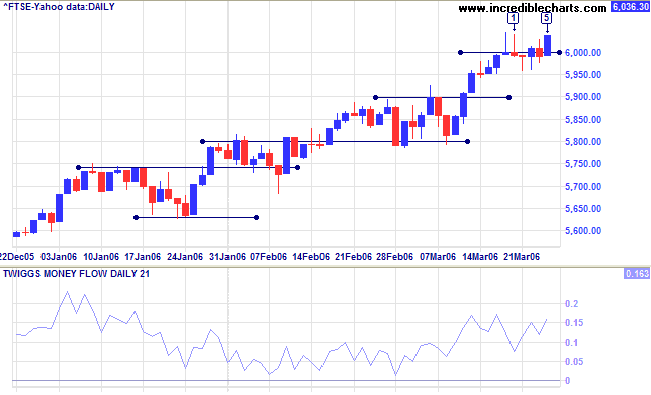
The FTSE 100 broke through stiff resistance at 6000. Long shadows last Friday and on Monday [1] warned of strong resistance, but long tails at [2] and [3] indicated strong buying. After a brief retracement on Thursday the index made a strong blue candle on Friday to break clear. Accumulation appears strong, but we cannot rule out a further retracement to test the new support level.
Medium Term: Twiggs Money Flow (21-day) is rising well above zero, confirming strong accumulation.
The Big Picture: The FTSE 100 is in a strong primary up-trend.
Japan
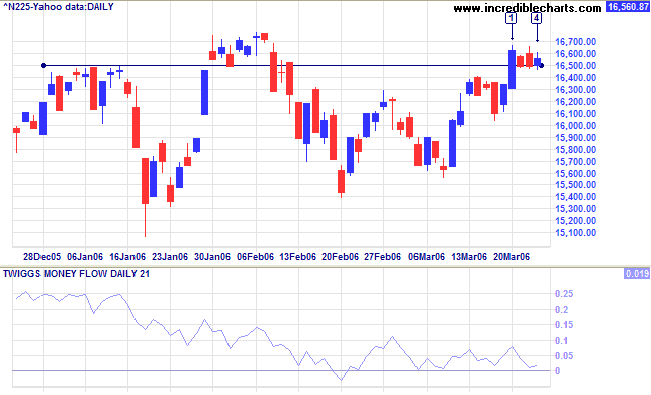
The Nikkei 225 started the week with a strong blue candle, breaking through the important 16500 resistance level. This was followed by a short retracement which successfully tested the new support level.
Medium Term: Twiggs Money Flow (21-day) is holding above the zero line, signaling accumulation.
The Big Picture: A rise above 16700 would confirm the primary up-trend.
ASX Australia
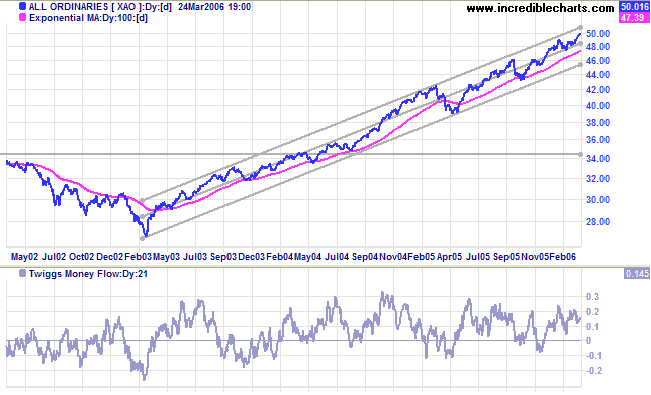
The All Ordinaries displays signs of profit-taking below 5000: narrow ranges and large volume at [2] and [5], signaling strong opposition between buyers and sellers, and a weak close on day [3]. The tendency of investors to pick the same major targets leads to resistance at round numbers. There may well be some hesitancy (consolidation) before sellers are sufficiently depleted and buyers can carry the index higher.
The All Ordinaries displays signs of profit-taking below 5000: narrow ranges and large volume at [2] and [5], signaling strong opposition between buyers and sellers, and a weak close on day [3]. The tendency of investors to pick the same major targets leads to resistance at round numbers. There may well be some hesitancy (consolidation) before sellers are sufficiently depleted and buyers can carry the index higher.
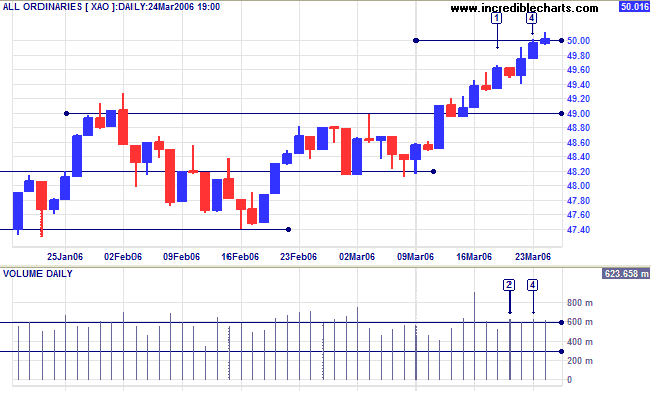
Medium Term: I drew a linear regression channel around the
primary up-trend (new drawing tools will be released with the
beta version early next month). The index respecting the upper
border of the channel (around 5100) would indicate that a
secondary correction may be imminent -- as would a fall below the
center linear regression line. The index is close to the current
target of 5050 (4900 + {4900 - 4750}), while
Twiggs Money Flow (21-day) is rising well above zero,
signaling further accumulation.
The Big Picture: The strong primary up-trend continues.
The Big Picture: The strong primary up-trend continues.
For further background information, read About
the Trading Diary.
Regards,
Regards,
Colin Twiggs
It doesn't matter which side of the fence you get off on
sometimes.
What matters most is getting off.
You cannot make progress without making decisions.
~ Jim Rohn
What matters most is getting off.
You cannot make progress without making decisions.
~ Jim Rohn

Author: Colin Twiggs is a former investment banker with almost 40 years of experience in financial markets. He co-founded Incredible Charts and writes the popular Trading Diary and Patient Investor newsletters.
Using a top-down approach, Colin identifies key macro trends in the global economy before evaluating selected opportunities using a combination of fundamental and technical analysis.
Focusing on interest rates and financial market liquidity as primary drivers of the economic cycle, he warned of the 2008/2009 and 2020 bear markets well ahead of actual events.
He founded PVT Capital (AFSL No. 546090) in May 2023, which offers investment strategy and advice to wholesale clients.