Trading Diary
March 18, 2006
These extracts from my daily trading diary are
for educational purposes and should not be interpreted as
investment advice. Full terms and conditions can be found at
Terms
of Use.
USA
The S&P 500 broke through resistance at 1295 on Tuesday, confirming that the primary trend has resumed. The long shadow at [4] signals profit-taking and we can expect a retracement to test the new support level. Increased volumes on Friday are attributable to triple-witching hour.
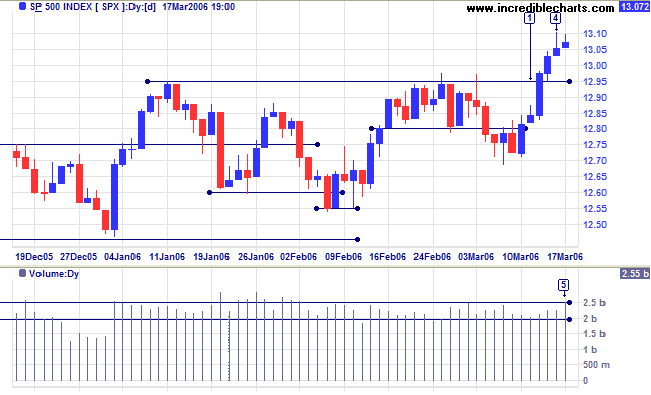
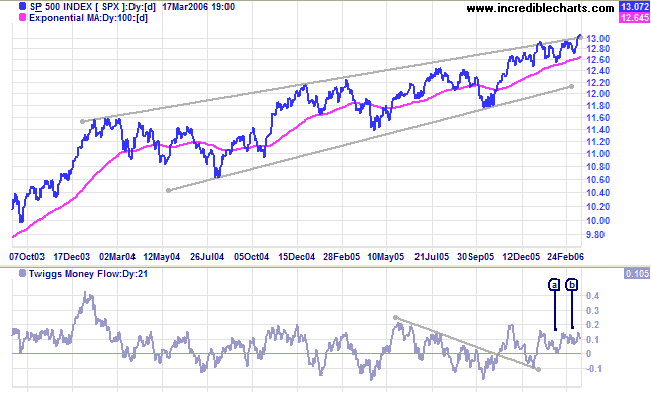
Medium Term: The rise above 1295/1300 signals a strong
up-trend.
Twiggs Money Flow (21-day) oscillating above zero signals
accumulation.
Long Term: The index has broken out above a 2-year bearish rising wedge pattern, signaling a stronger primary up-trend. Look for confirmation from a retracement that respects the upper border of the wedge.
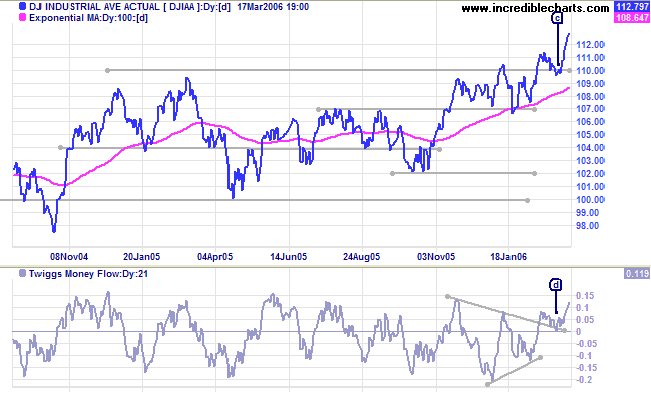
The Dow Industrial Average respected support at 11000 at
[c] before rising sharply through short-term resistance at 11100
with a string of blue candles.
Medium Term: The rise above the previous high at 11150 confirms that the Dow has moved into a stronger primary up-trend. Twiggs Money Flow (21-day) respected the zero line at [d]: a bullish sign.
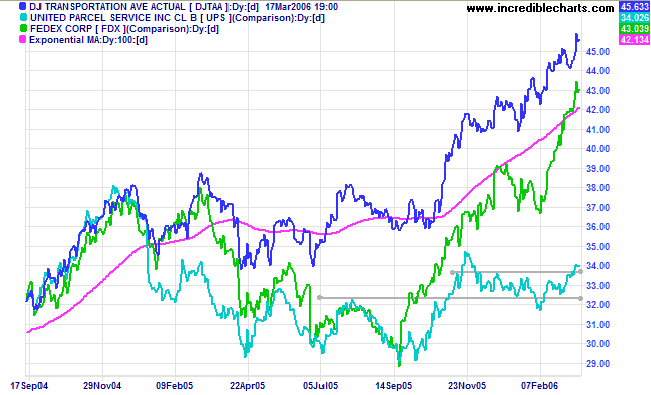
The Dow Jones Transportation Average and lead indicator
Fedex are in strong primary up-trends. UPS is now in an
intermediate up-trend and will resume a primary up-trend if it
rises above its November high. All three indicators are positive
and signal increasing economic activity.
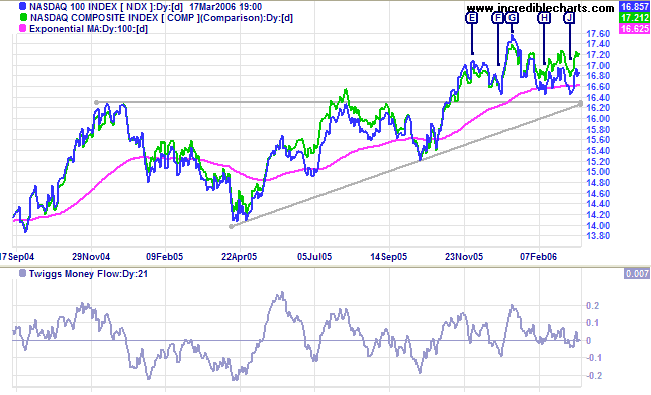
The Nasdaq 100 again successfully tested support at [J],
while the broader Nasdaq Composite is strengthening. A
close below 1640 would complete a bearish
head and shoulders, signaling a primary trend reversal, but a
rise above 1700 would signal an intermediate up-trend.
Twiggs Money Flow (21-day) whipsawing around zero shows
uncertainty.
Treasury yields
Lower core CPI figures from the Labor Department have tamed inflation fears, though further rate hikes from the Fed remain likely. The 10-Year treasury yield is retracing to test the new support level at 4.60/4.65%. A successful test would confirm the breakout.
Medium Term: A rise in long-term rates could have an adverse effect on the buoyant property market, but enhance the attraction of the dollar as an investment currency. In the end, this may be a better option than a negative yield curve -- the forerunner of most economic down-turns.
Long Term: The yield differential (10-year T-notes minus 13-week T-bills) is again approaching zero. We are already witnessing declining bank margins and a negative yield differential would warn of a likely credit squeeze.
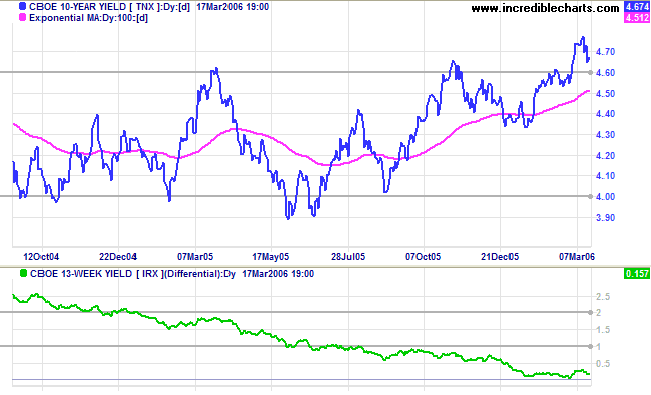
The Big Picture: Strong showings from the Dow, S&P
500, and transport indicators indicate that equity markets are
gathering momentum. However, wage inflation, short-term interest
rates, and the flat yield curve remain a worry and need to be
monitored closely.
Gold
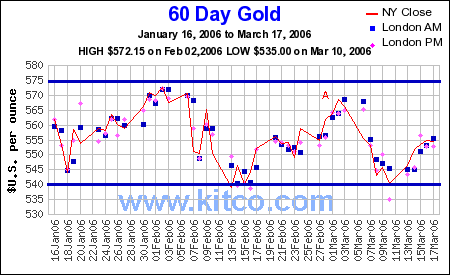
Spot gold is currently at $554.00, having successfully tested primary support at $535/$540.
Medium Term: The bearish lower high at [A] has been somewhat neutralized by the successful test of support. A higher short-term retracement, would complete the recovery.
The Big Picture: Gold is consolidating between $540 and $575. A break outside this range would signal the future direction of the primary trend.
Crude Oil
Light Crude rose to $62.77/barrel. A Light Crude or Brent Crude fall below medium-term support at $58 would be bearish, while a drop below $55 would indicate a primary trend reversal -- and a strong bear signal for gold. A rise above $70/barrel, on the other hand, would be bullish.
Currencies
The dollar displays short-term weakness against major trading partners.
Medium Term: The euro is strengthening against the dollar, with a higher low at [E], and is now threatening to break above the previous high at [D]. Against the yen, the dollar made a false break above the recent triangle at [5] before reversing below at [6]; it now appears headed for a test of support at the low of [2].
The Big Picture: A rise above [D] would signal that the euro has commenced a primary up-trend against the dollar. A fall below [2] would signal that the yen has commenced a primary up-trend against the dollar.
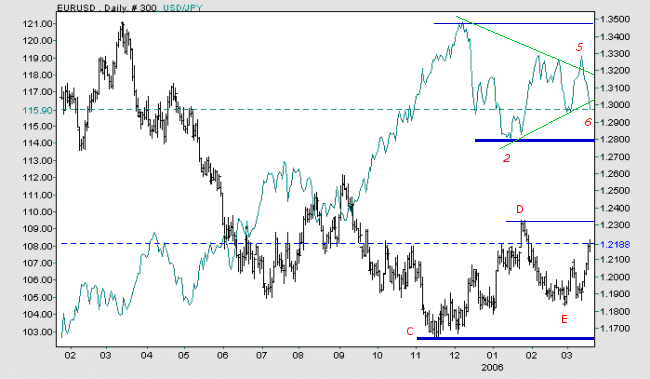
Source: Netdania
United Kingdom
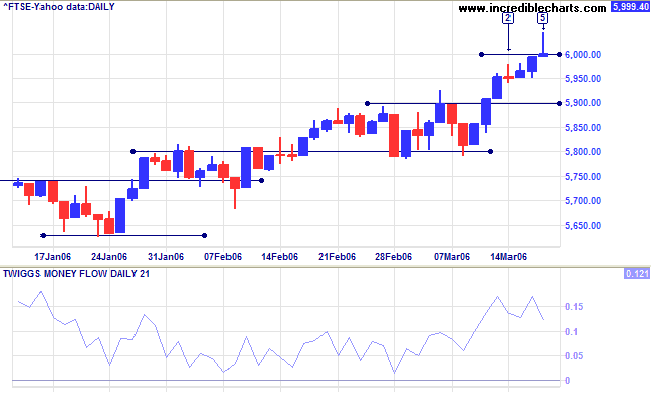
The FTSE 100 broke clear of resistance at 5900 on Monday, before encountering further resistance at 6000 -- signaled by long shadows at [2] and [5]. Expect a retracement to test support at 5900.
Medium Term: Twiggs Money Flow (21-day) is holding well above zero, signaling accumulation. A retracement that respects new support at 5900 would confirm the up-trend, while a close above 6000 would be another bullish sign..
The Big Picture: The FTSE 100 is in a strong primary up-trend.
Japan
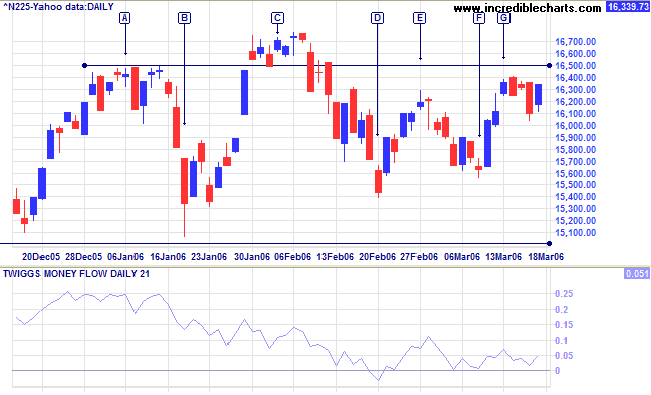
The Nikkei 225 broke through short-term resistance at 16300 and, after a few days consolidation, appears headed for a test of 16500.
Medium Term: Twiggs Money Flow (21-day) is holding above the zero line, signaling accumulation. The index commenced an intermediate up-trend after a higher low at [F] followed by a higher high at [G], but gains are small and momentum weak.
The Big Picture: The Nikkei has established a solid base at 15200 and a rise above the high of [C] would signal resumption of the primary up-trend.
ASX Australia
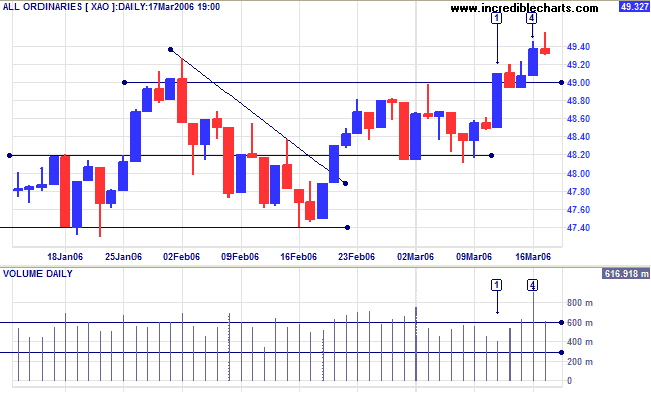
The All Ordinaries exhibited a strong blue candle on Monday at [1], breaking through resistance at 4900. This was followed by profit-taking, with weak closes on days [2] and [3], before buyers took control on day [4]. Exceptional volume is due to the option close-out at mid-day Thursday -- in the third week of the last month of each quarter. The long shadow and weak close on Friday indicate further selling and we can expect a test of the new support level at 4900. A successful test, or a false break below support, will confirm the up-trend.
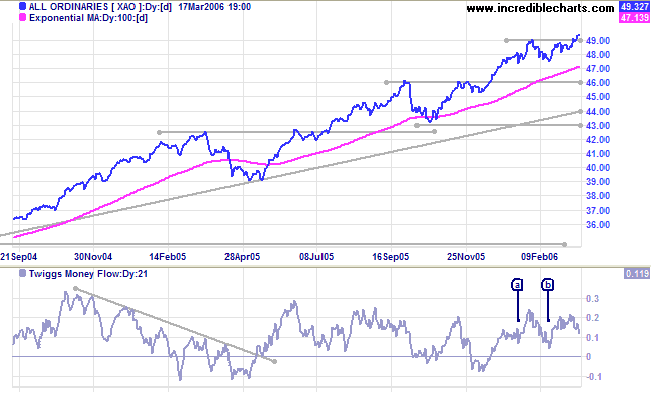
Medium Term: The index rose above 4900, continuing the
primary up-trend. The target is 5050 (4900 + {4900 - 4750}), but
expect some profit-taking at 5000.
Twiggs Money Flow (21-day) is oscillating above zero:
signaling accumulation.
The Big Picture: The strong primary up-trend continues.
For further background information, read About
the Trading Diary.
Regards,
Regards,
Colin Twiggs
The remarkable thing is that we really love our neighbor as
ourselves:
we do unto others as we do unto ourselves.
We hate others when we hate ourselves.
We are tolerant toward others when we tolerate ourselves.
We forgive others when we forgive ourselves.
We are prone to sacrifice others when we are ready to sacrifice ourselves.
~ Eric Hoffer
we do unto others as we do unto ourselves.
We hate others when we hate ourselves.
We are tolerant toward others when we tolerate ourselves.
We forgive others when we forgive ourselves.
We are prone to sacrifice others when we are ready to sacrifice ourselves.
~ Eric Hoffer