Trading Diary
March 11, 2006
These extracts from my daily trading diary are
for educational purposes and should not be interpreted as
investment advice. Full terms and conditions can be found at
Terms
of Use.
USA
The S&P 500 closed below short-term support at 1280 on day [1]. Long tails at [2] and [3] show some belated buying support before a bearish close at [4] followed by a bullish outside day at [5]. The pattern signals hesitancy from both buyers and sellers, with neither ready to take control. A close below 1270 would be bearish, signaling a test of support at 1255/1250, while a close above 1285 would signal another test of resistance at 1295/1300.
The S&P 500 closed below short-term support at 1280 on day [1]. Long tails at [2] and [3] show some belated buying support before a bearish close at [4] followed by a bullish outside day at [5]. The pattern signals hesitancy from both buyers and sellers, with neither ready to take control. A close below 1270 would be bearish, signaling a test of support at 1255/1250, while a close above 1285 would signal another test of resistance at 1295/1300.
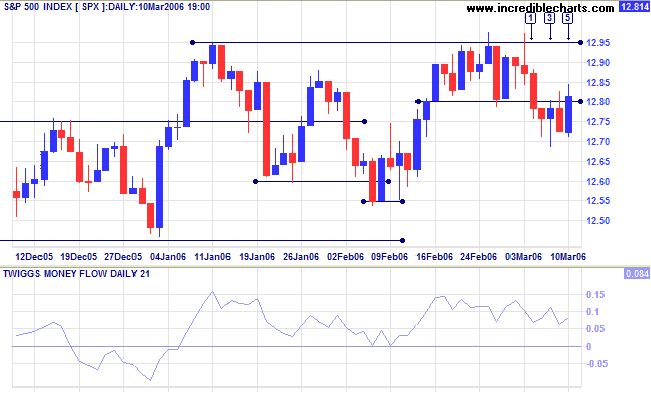
Medium Term: A close above 1295/1300 would indicate a
strong up-trend; while a close below 1250 would mean a secondary
correction.
Twiggs Money Flow (21-day) is holding above zero: signaling
accumulation.
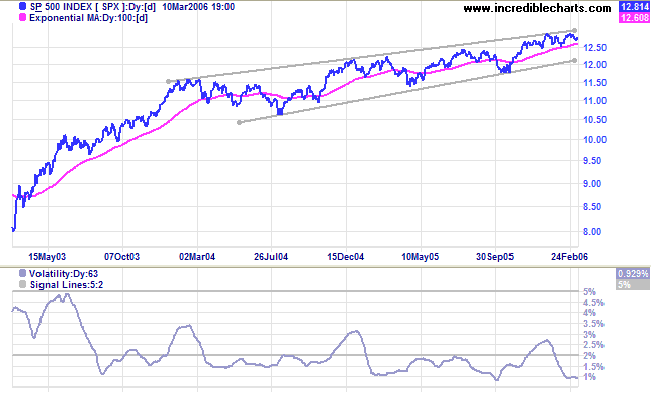
Long Term: The index remains within a 2-year bearish rising wedge pattern. A breakout would signal a strong primary up-trend. Volatility is at historically low levels, which is normally followed by a strong move -- in either direction.
Long Term: The index remains within a 2-year bearish rising wedge pattern. A breakout would signal a strong primary up-trend. Volatility is at historically low levels, which is normally followed by a strong move -- in either direction.
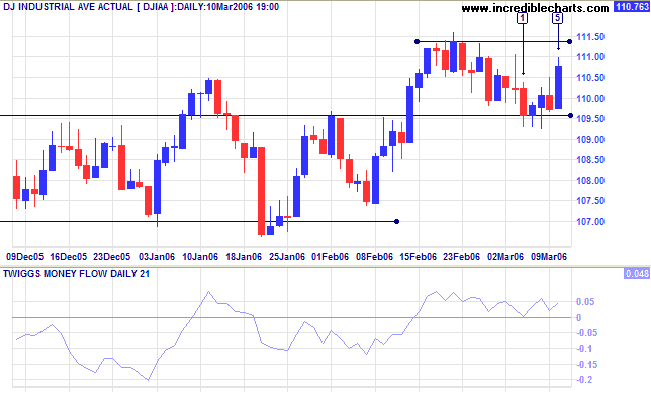
The Dow Industrial Average successfully tested support at
10960/10950, with long tails from [1] to [3] signaling
accumulation.
Medium Term: A close below 10950 would indicate trend weakness; consolidation between 10950 and 11150 would be bullish; while a close above 11150 would signal a strong up-trend. Twiggs Money Flow (21-day) is holding above zero: a positive sign.
Medium Term: A close below 10950 would indicate trend weakness; consolidation between 10950 and 11150 would be bullish; while a close above 11150 would signal a strong up-trend. Twiggs Money Flow (21-day) is holding above zero: a positive sign.
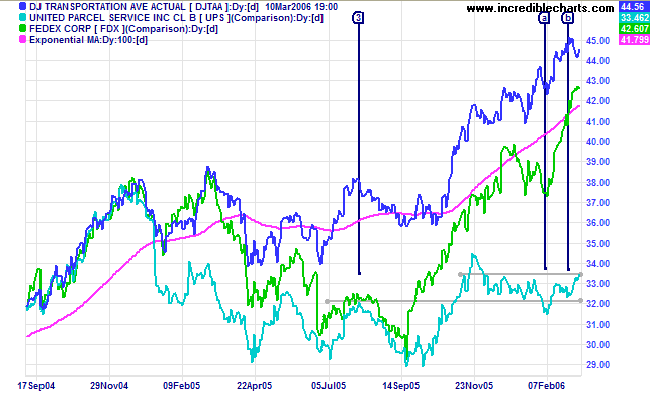
The Dow Jones Transportation Average and lead indicator
Fedex are in strong primary up-trends. UPS is now bullish after a
bear trap at [a] followed by a higher low at [b] respecting the
support level from [3]. All three indicators trending upwards
would be a strong bullish sign.
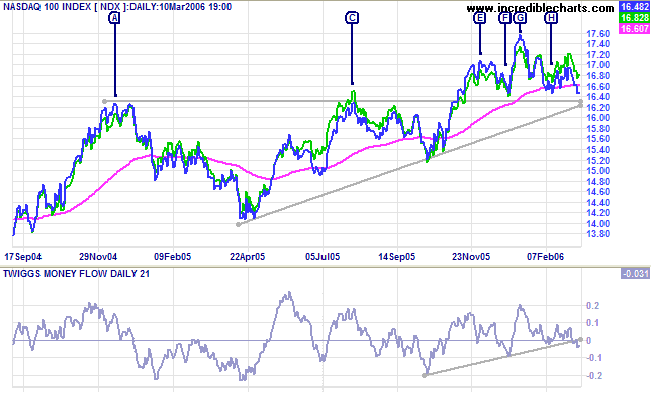
The Nasdaq 100 is again testing support at 1630/1640,
while the broader Nasdaq
Composite is stronger. A close below support would
complete a bearish
head and shoulders: signaling a primary trend reversal. It is
important to remember that H&S is not a valid signal until it
is completed.
Twiggs Money Flow (21-day) below zero indicates short-term
weakness, but a long tail on Friday's candle signals support.
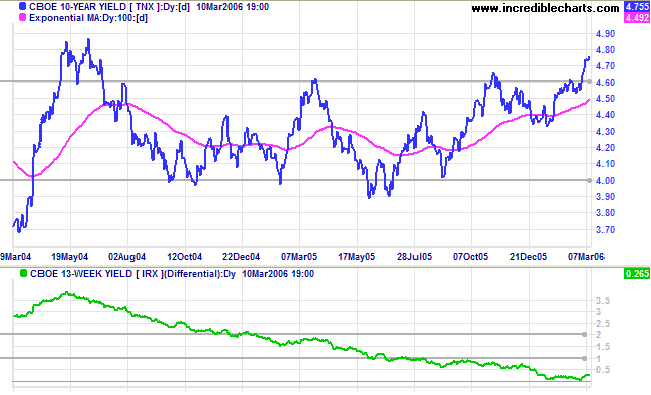
Treasury yields
A 3.5% jump in average hourly wages (for the month of February) increases the prospects of further short-term rate hikes; and the 10-Year treasury yield broke through resistance at 4.60/4.65% to a new 1-year high. Look for confirmation of the up-trend: from a retracement that respects the new support level.
Medium Term: A rise in long-term rates may have an adverse effect on the buoyant property market. The yield differential (10-year T-notes minus 13-week T-bills), however, rebounded to 0.265%. We are not out of the woods yet: the differential needs to rise substantially to correct the past imbalance.
The Big Picture: Transport indicators are improving, but
rising short- and long-term yields may slow growth in the medium
term. Equity indexes are edging slowly upwards, without showing
real commitment.
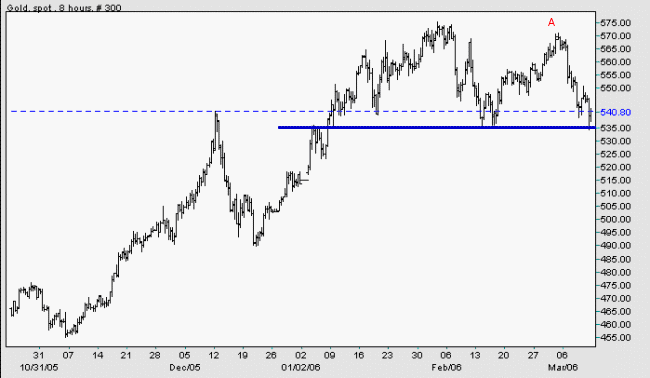
Gold
Spot gold is currently at $540.80, testing primary support at $535/$540.
Medium Term: The lower high at [A] is a bearish sign.
Crude Oil: Rising oil prices enhance the appeal of gold as an inflation hedge. Light/Brent Crude is currently priced around $60/barrel. A fall below medium-term support at $58 would be bearish; while a drop below $55 would indicate a primary trend reversal (a strong bear signal for gold). A rise above $70/barrel, however, would be bullish.
The Big Picture: A fall below $535 would signal that gold has entered a primary down-trend; confirmed if there is a pull-back that respects the new resistance level.
Source: Netdania
Currencies
The euro is weakening against the US dollar. Having fallen below primary support at the low of [A] -- before retreating -- a fall below the low of [B] would confirm the primary down-trend.
The dollar completed a triangle against the yen, with a (bullish) breakout above the upper border on Friday.
The Big Picture: The US dollar is strengthening against major trading partners.

Source: Netdania
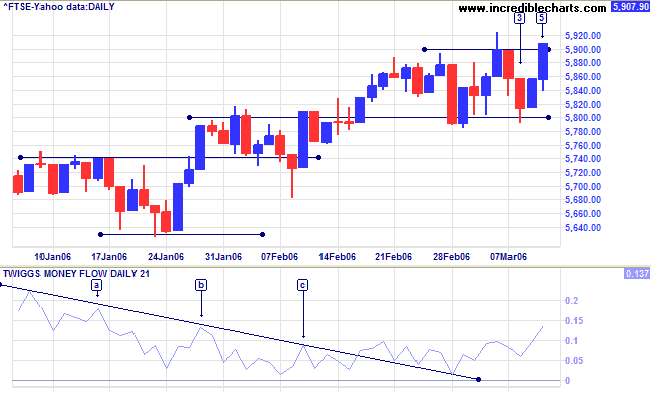
United Kingdom
The FTSE 100 encountered resistance at 5900 on Monday, before retreating to test support at 5800 -- long tails at [2] and [3] signaling accumulation. The strong rally at the end of the week, ending with a close above 5900 at [5], shows that the up-trend is intact.
Medium Term: Twiggs Money Flow (21-day) remains above zero, signaling buying support. A breakout followed by a retracement that respects support at 5900 would be a further bullish sign; while a close below 5800 would be bearish.
The Big Picture: The FTSE 100 is in a strong primary up-trend.
Japan
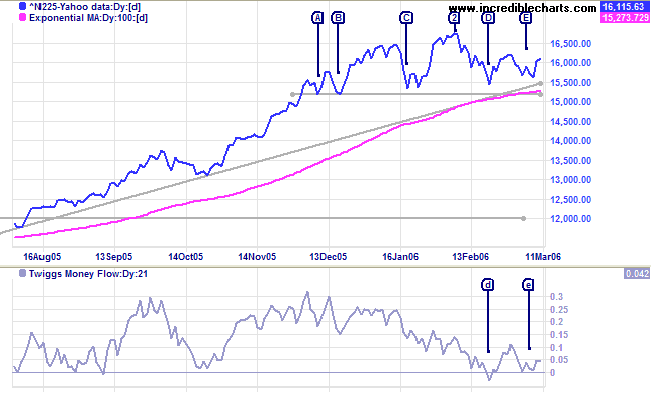
The Nikkei 225 is testing resistance at 16200/16300.
Medium Term: Twiggs Money Flow (21-day) is holding above the zero line, signaling accumulation. A close above 16300 would be bullish, signaling a test of resistance at the high of [2].
The Big Picture: The Nikkei has established a solid base at 15200 and a rise above the high of [2] would signal resumption of the primary up-trend.
ASX Australia
The All Ordinaries exhibits buying support, with long tails from [1] to [4]. The narrow range and weak close at [5], however, indicate hesitancy. A close above 4900 would signal continuation of the primary up-trend, while a close below 4820 would be bearish.
The All Ordinaries exhibits buying support, with long tails from [1] to [4]. The narrow range and weak close at [5], however, indicate hesitancy. A close above 4900 would signal continuation of the primary up-trend, while a close below 4820 would be bearish.
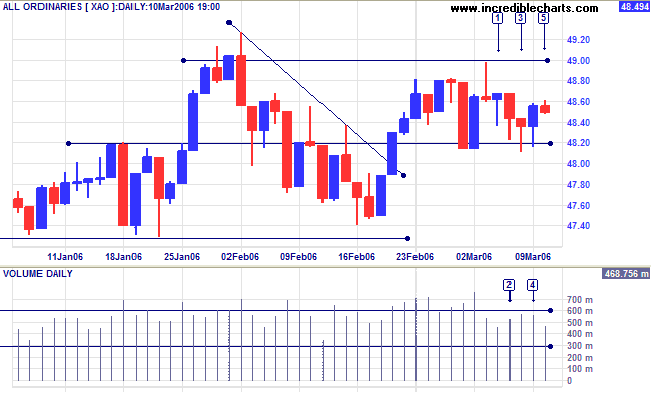
Medium Term: The index is consolidating in a narrow range
below 4900. Normally this is a strong bullish sign, but we need
to exercise caution as, so far, the index has mainly tested
support. A close above 4900 would show continuation of the
primary trend, while a close below 4740 would signal a secondary
correction.
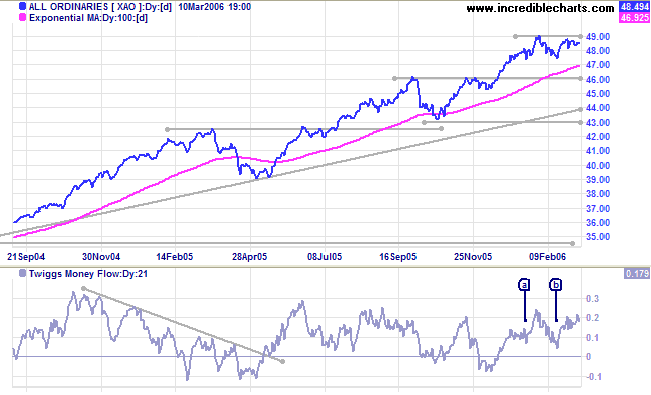
Twiggs Money Flow (21-day) is oscillating above zero: a positive sign.
Accumulation-Distribution continues above its' 100-day moving average: a positive sign.
The Big Picture: The strong primary up-trend continues.
Twiggs Money Flow (21-day) is oscillating above zero: a positive sign.
Accumulation-Distribution continues above its' 100-day moving average: a positive sign.
The Big Picture: The strong primary up-trend continues.
For further background information, read About
the Trading Diary.
Regards,
Regards,
Colin Twiggs
You can never get enough of what you don't need to make you
happy.
~ Eric Hoffer
~ Eric Hoffer

Author: Colin Twiggs is a former investment banker with almost 40 years of experience in financial markets. He co-founded Incredible Charts and writes the popular Trading Diary and Patient Investor newsletters.
Using a top-down approach, Colin identifies key macro trends in the global economy before evaluating selected opportunities using a combination of fundamental and technical analysis.
Focusing on interest rates and financial market liquidity as primary drivers of the economic cycle, he warned of the 2008/2009 and 2020 bear markets well ahead of actual events.
He founded PVT Capital (AFSL No. 546090) in May 2023, which offers investment strategy and advice to wholesale clients.