Trading Diary
March 4, 2006
These extracts from my daily trading diary are
for educational purposes and should not be interpreted as
investment advice. Full terms and conditions can be found at
Terms
of Use.
USA
The S&P 500 is testing resistance at the recent high of [A]. The weak close and low volume at [1] and the tall shadow and declining volume at [5] both signal an absence of buying pressure.
The S&P 500 is testing resistance at the recent high of [A]. The weak close and low volume at [1] and the tall shadow and declining volume at [5] both signal an absence of buying pressure.
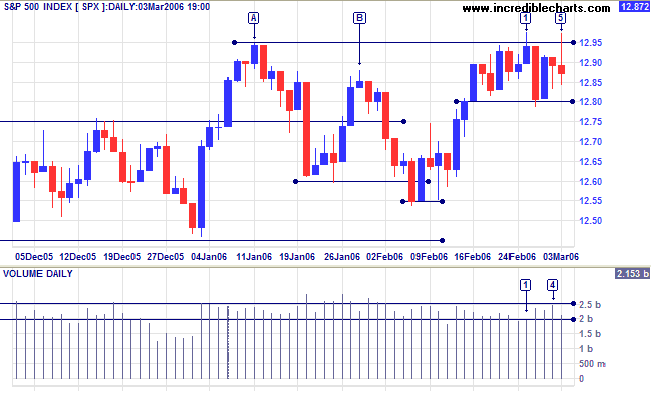
Medium Term: A close below 1280 would signal weakness and
a likely test of intermediate support at 1245/1250; consolidation
in a narrow band between 1280 and 1295 would be bullish; while a
close above 1295/1300 would signal a strong up-trend.
Twiggs Money Flow (21-day) is holding above zero: a positive sign.
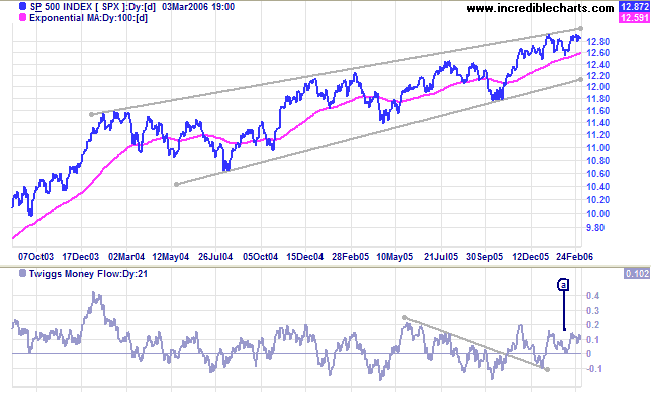
Long Term: The index is testing the upper border of a 2-year bearish rising wedge pattern. A breakout would signal a strong primary up-trend.
Twiggs Money Flow (21-day) is holding above zero: a positive sign.
Long Term: The index is testing the upper border of a 2-year bearish rising wedge pattern. A breakout would signal a strong primary up-trend.
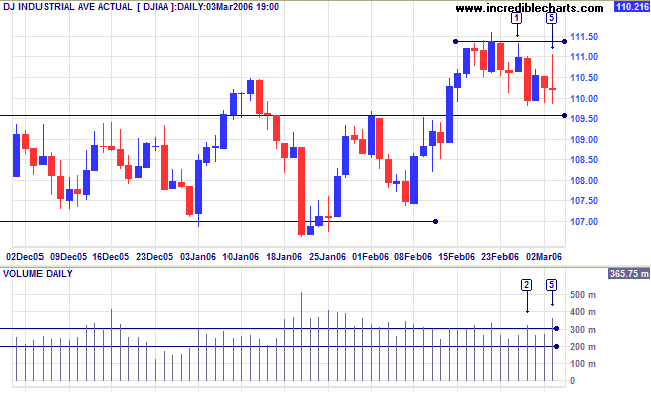
The Dow Industrial Average started Monday [1] with a weak
close after testing resistance at 11150. A large red candle and
strong volume [2] failed to penetrate support at 10950, but a
long tail and strong volume at [5] indicate continued selling
pressure.
Twiggs Money Flow (21-day) is above zero: a short-term
positive.
Medium Term: A close below 10950 would indicate trend weakness; consolidation between 10950 and 11150 would be bullish; while a close above 11150 would signal a strong up-trend. Twiggs Money Flow (21-day) oscillates across the zero line: a neutral sign.
Medium Term: A close below 10950 would indicate trend weakness; consolidation between 10950 and 11150 would be bullish; while a close above 11150 would signal a strong up-trend. Twiggs Money Flow (21-day) oscillates across the zero line: a neutral sign.
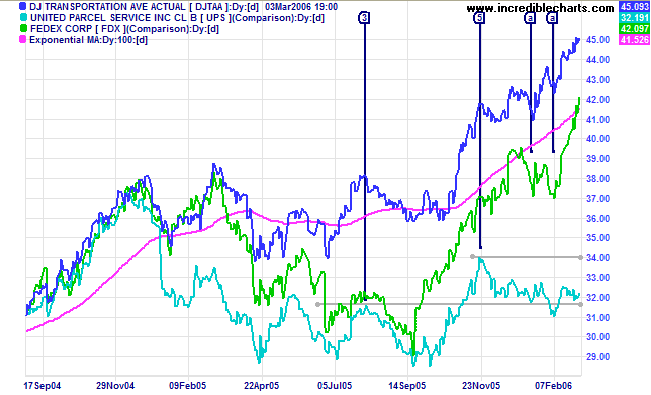
The Dow Jones Transportation Average and lead indicator
Fedex are in strong primary up-trends. UPS, however, continues to
consolidate. A rise above the high of [5] would confirm the
primary up-trend; while a fall below the February low would be
bearish.
The Nasdaq 100 and Nasdaq
Composite have twice respected support (at [F] and
[H]) from previous highs [A] and [C]. A rise above the high of
[G] would be a strong bull signal for US equity markets.
Twiggs Money Flow (21-day) is steadily rising above zero --
another positive sign.
Though less likely, a fall below the recent lows of [F] and [H] would signal weakness.
A reader pointed out that the recent pattern resembles the start of a head and shoulders -- with the left shoulder at [E] and the head at [G]. It is important to remember that H&S is not a valid signal until it is completed -- even if the start of the right shoulder resembles a bear flag. At a guess I would say 3 out of 4 potential H&S patterns never complete.

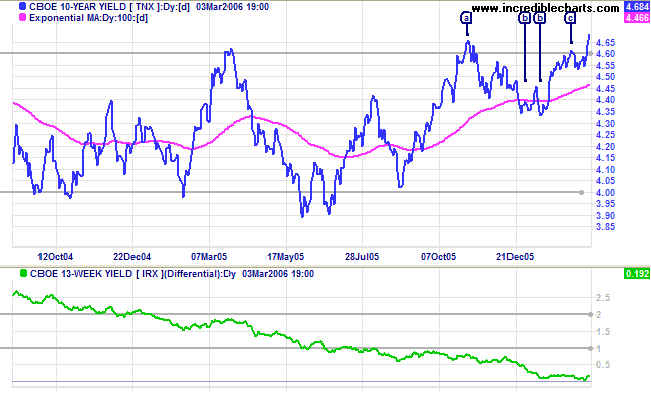
Treasury yields
The 10-Year treasury yield broke through resistance at 4.60/4.65% after a (bullish) narrow consolidation at [c]. Look for confirmation from a pull-back that respects the new support level.
Medium Term: An up-trend would have a negative effect on the buoyant property market, but may avert a negative yield curve which is a serious threat to the economy. The yield differential (10-year T-notes minus 13-week T-bills) rebounded slightly after hovering just above zero for the past few weeks.
The Big Picture: All three equity indexes show positive
signs, but none has yet made a decisive breakout. The Dow
Transport index and lead indicator Fedex are in strong primary
up-trends, but UPS remains uncertain. The yield differential
(between long-term notes and short-term bills) remains close to
zero and a negative yield curve would make the economy vulnerable
to a down-turn. Rising long-term yields may slow growth but
avoid a sharp down-turn later.
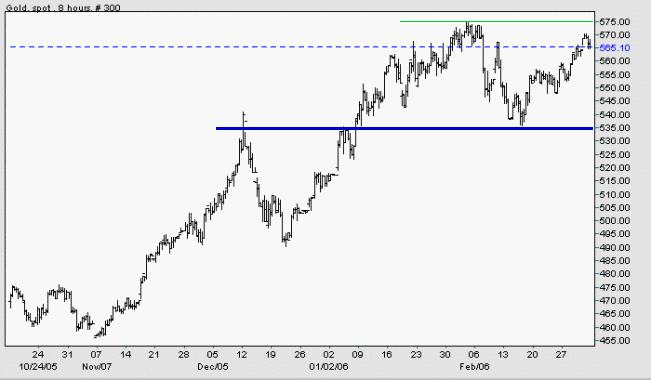
Gold
Spot gold is currently at $565.10 and is headed for a test of resistance at $575.
Medium Term: A rise above $575 would signal continuation of the primary trend with a target of 615 (575 + {575 - 535}); while failure to break through resistance would mean either a (bullish) narrow consolidation or else a re-test of primary support at $535.
The Big Picture: Rising oil prices enhance the appeal of gold as an inflation hedge. Gold should continue its' strong primary up-trend as long as oil prices remain high. A drop below $55/barrel for Light/Brent crude would be a bear alert; while a rise above $70 would be a bull signal.
Source: Netdania
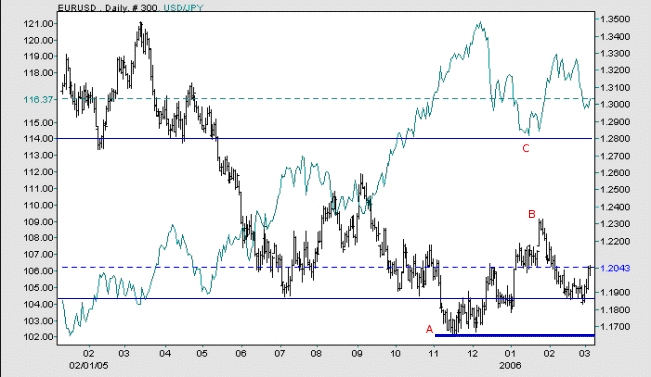
Currencies
The euro is testing primary support against the US dollar, having fallen below primary support at 1.185 before reversing to [B]. A fall below the low of [A] would confirm the primary down-trend.
Against the yen, the dollar is in a primary up-trend after breaking above 114 in October 2005. The greenback then retreated to successfully test the new support level at [C]. The up-trend will continue -- so long as the dollar holds above 114.
The Big Picture: The US dollar is strengthening against major trading partners.
Source: Netdania
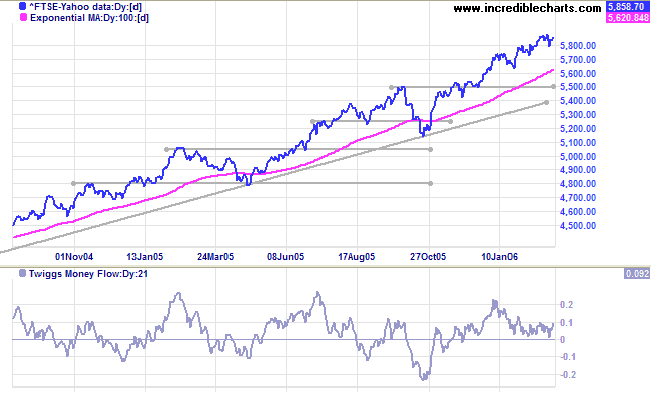
United Kingdom
The FTSE 100 is consolidating between 5800 and 5880.
Medium Term: The index has reached its' target of 5860 (5500 + {5500 - 5140}) -- so we need to be alert for profit-taking (and a possible secondary correction) below 6000 -- but Twiggs Money Flow (21-day) continues to hold above zero, signaling buying support.
The Big Picture: The FTSE 100 is in a strong primary up-trend. Initial support is at 5500 and primary support at 5140.
Japan
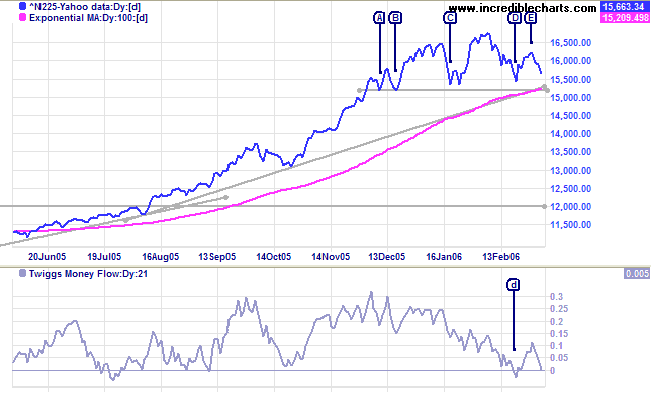
The Nikkei 225 is headed for another test of support at 15200.
Medium Term: The index has a solid base at 15200, having respected the support level 4/5 times. However, the lower high at [E] is bearish and Twiggs Money Flow (21-day) is again testing the zero line. Other signs to look out for are a break of the 100-Day MA or the long-term trendline.
The Big Picture: The Nikkei remains in a primary up-trend, but a close below 15200 would reverse to a down-trend.
ASX Australia
The All Ordinaries displays uncertainty, with increased volume at [2] and a weak close at [5] highlighting resistance between 4880 and 4920; and strong volume at [3] and [4] indicating support at 4820. A close above 4900 would signal continuation of the primary up-trend; a close below 4820 would be bearish.
The All Ordinaries displays uncertainty, with increased volume at [2] and a weak close at [5] highlighting resistance between 4880 and 4920; and strong volume at [3] and [4] indicating support at 4820. A close above 4900 would signal continuation of the primary up-trend; a close below 4820 would be bearish.
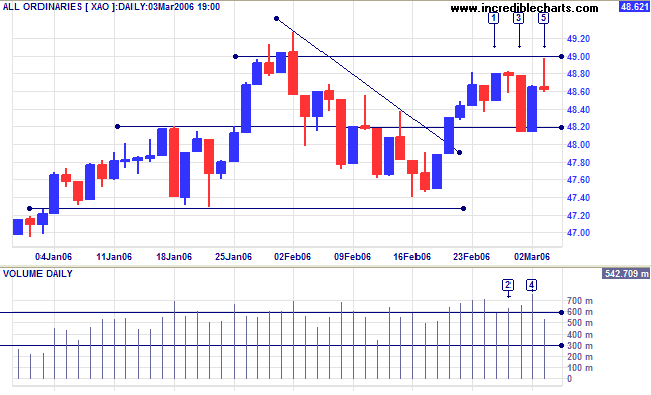
Medium Term: The index is near the target of 4940 (4620 +
{4620 - 4300}) -- which may account for some of the
profit-taking. A close above 4900 would signal continuation of
the primary trend, while a close below 4740 would warn of a
secondary correction.
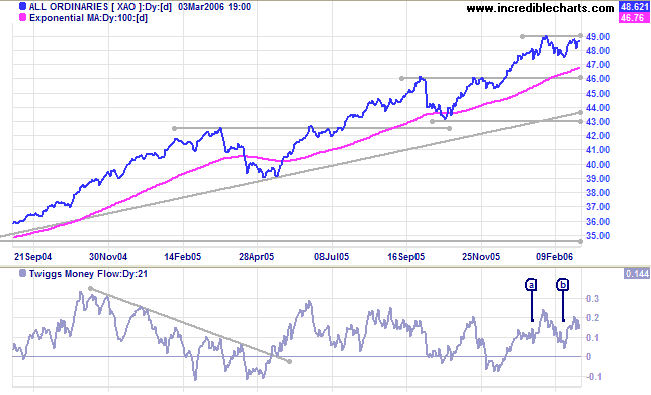
Twiggs Money Flow (21-day) is oscillating above zero: a positive sign.
Accumulation-Distribution continues above its' 100-day moving average: a positive sign.
The Big Picture: The strong primary up-trend continues. Initial support is at 4600; primary support at 4300.
Twiggs Money Flow (21-day) is oscillating above zero: a positive sign.
Accumulation-Distribution continues above its' 100-day moving average: a positive sign.
The Big Picture: The strong primary up-trend continues. Initial support is at 4600; primary support at 4300.
For further background information, read About
the Trading Diary.
Regards,
Regards,
Colin Twiggs
Have confidence that if you have done a little thing well, you
can do a bigger thing well too.
~ David Storey
~ David Storey

Author: Colin Twiggs is a former investment banker with almost 40 years of experience in financial markets. He co-founded Incredible Charts and writes the popular Trading Diary and Patient Investor newsletters.
Using a top-down approach, Colin identifies key macro trends in the global economy before evaluating selected opportunities using a combination of fundamental and technical analysis.
Focusing on interest rates and financial market liquidity as primary drivers of the economic cycle, he warned of the 2008/2009 and 2020 bear markets well ahead of actual events.
He founded PVT Capital (AFSL No. 546090) in May 2023, which offers investment strategy and advice to wholesale clients.