Trading Diary
February 25, 2006
These extracts from my daily trading diary are
for educational purposes and should not be interpreted as
investment advice. Full terms and conditions can be found at
Terms
of Use.
USA
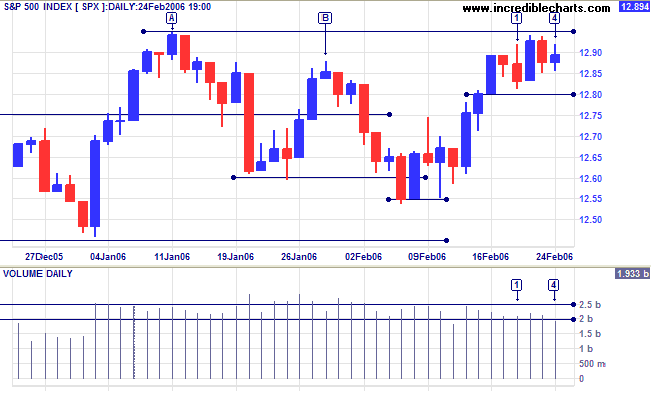
The S&P 500 is testing resistance at the recent high of [A]. A close above this level would be a bull signal for the index. If support at 1280 holds, we are likely to see a narrow consolidation followed by a breakout. The inside day and low volume at [4] signal uncertainty -- probably short-term reaction to the failed attack on a major Saudi oil refinery.
The S&P 500 is testing resistance at the recent high of [A]. A close above this level would be a bull signal for the index. If support at 1280 holds, we are likely to see a narrow consolidation followed by a breakout. The inside day and low volume at [4] signal uncertainty -- probably short-term reaction to the failed attack on a major Saudi oil refinery.
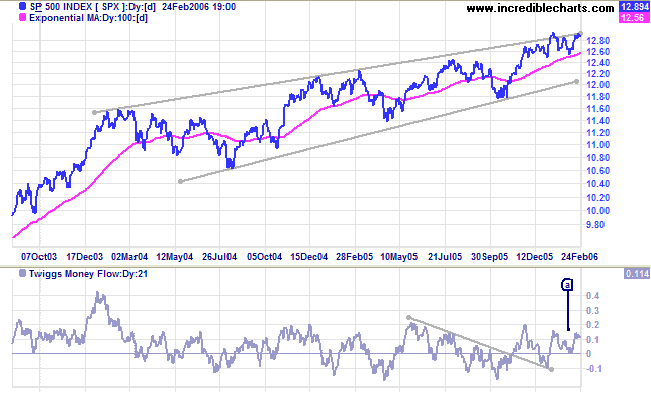
The index is testing the upper border of a 2-year bearish
rising wedge pattern and
Twiggs Money Flow (21-day) completed a bullish trough above
zero at [a]. A clear break through resistance at 1295/1300 would
signal acceleration of the primary up-trend.
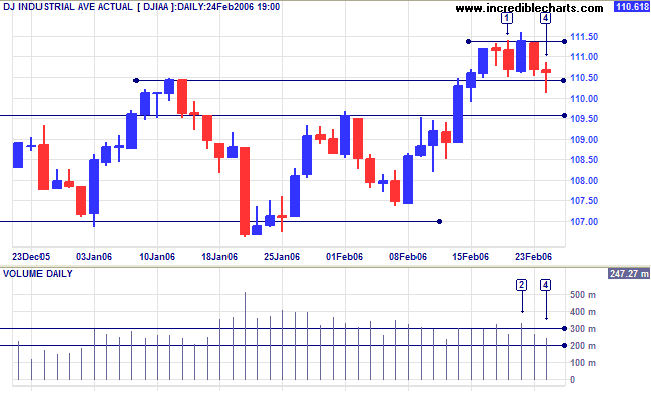
The Dow Industrial Average started Tuesday [1] with
consolidation above the new support level at 11050; strong volume
signaling resistance at [2]. The long tail and declining volume
at [4] indicate no real selling pressure.
Twiggs Money Flow (21-day) is above zero: a short-term
positive. An index close above 11150 would confirm the recent
breakout.
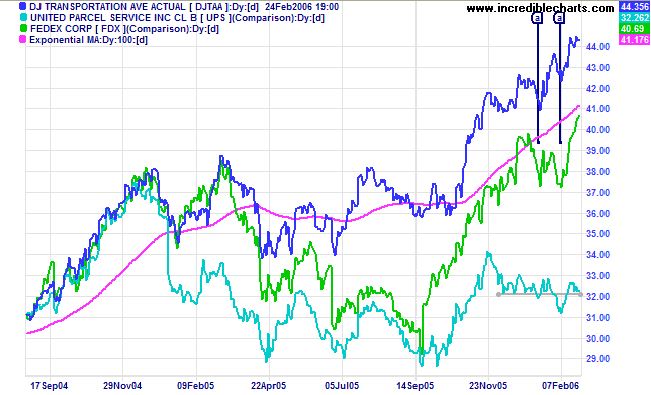
The Dow Jones Transportation Average continues in a strong
primary up-trend. Lead indicator Fedex resumed a strong up-trend
after a bullish double bottom at [a]. UPS, however, remains
ambivalent.
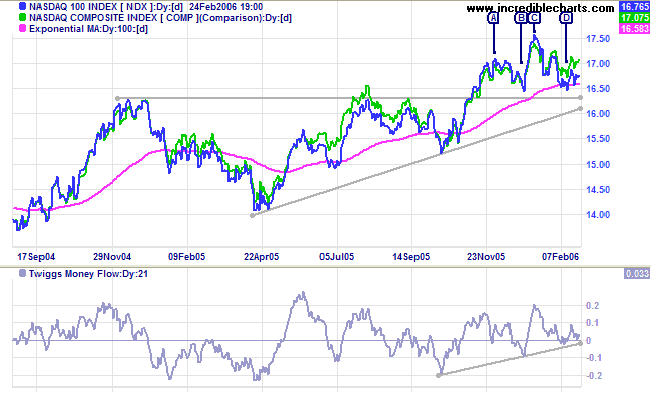
The Nasdaq 100 and Nasdaq Composite have twice
respected support from previous highs. A rise above the high of
[C] would be a strong bull signal for US equity markets.
Twiggs Money Flow (21-day) is holding above zero -- another
positive sign.
Though less likely, a fall below the recent lows of [B] and [D] would signal trend weakness.
I have discarded the long-term bearish rising wedge patterns because signals from the two indexes conflict.
Though less likely, a fall below the recent lows of [B] and [D] would signal trend weakness.
I have discarded the long-term bearish rising wedge patterns because signals from the two indexes conflict.
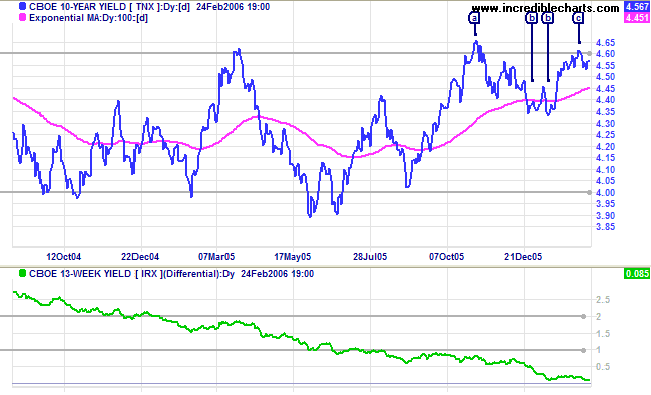
Treasury yields
The 10-Year treasury yield appears headed for another test of resistance at 4.60/4.65%. This is a positive sign: narrow consolidation below resistance signals that a breakout is imminent. However, short-term yields are climbing rapidly and the yield differential (10-year T-notes minus 13-week T-bills) is approaching zero -- a (long-term) negative sign for the economy.
The 10-Year treasury yield appears headed for another test of resistance at 4.60/4.65%. This is a positive sign: narrow consolidation below resistance signals that a breakout is imminent. However, short-term yields are climbing rapidly and the yield differential (10-year T-notes minus 13-week T-bills) is approaching zero -- a (long-term) negative sign for the economy.
The Big Picture: There are promising signs on all three
equity indexes and the Dow Transport index and lead indicator
Fedex are in strong primary up-trends, but UPS remains uncertain.
The only real negative is that the yield differential (between
long-term notes and short-term bills) is approaching zero. A
negative yield curve would make the economy vulnerable to a
down-turn.
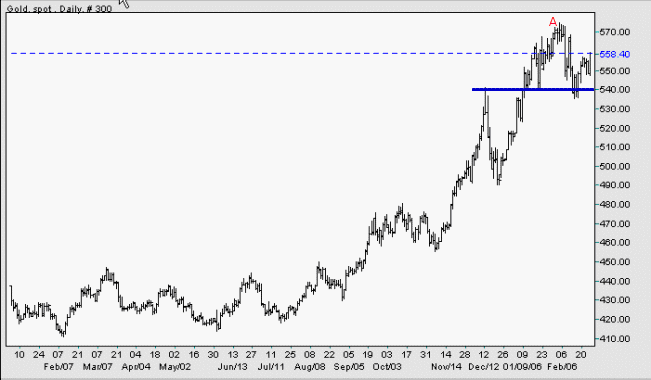
Gold
Spot gold is currently at $558.40. The metal successfully tested support at $540 and is now rallying toward a test of resistance at the recent high of $575 at [A]. The rally off the first line of support (at the previous high of $540) -- well above primary support at the previous low of $490 -- signals that price is in a strong primary trend.
The Big Picture: There is a historic correlation between gold and oil prices -- rising oil prices enhance the appeal of gold as an inflation hedge. Gold should continue its' strong primary up-trend as long as crude oil prices remain high.
Source: Netdania
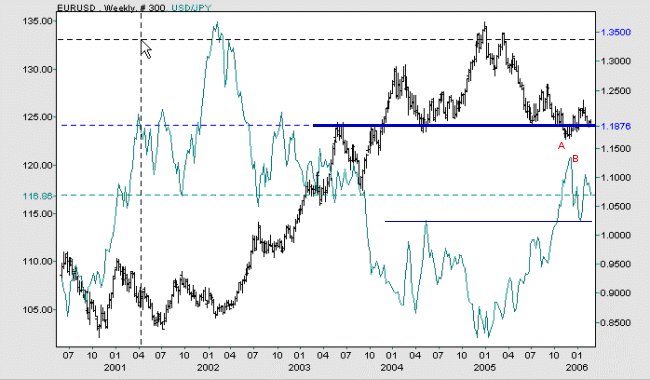
Currencies
The euro is testing primary support against the US dollar; a fall below the low of [A] would confirm the primary down-trend. Against the yen, the dollar is testing support at 115. A breakout above the recent high of [B] would confirm the primary up-trend.
The Big Picture: The US dollar is strengthening against major trading partners.
Source: Netdania
United Kingdom
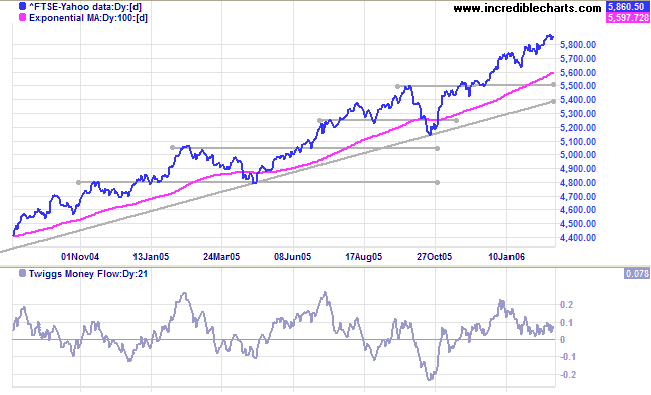
The FTSE 100 encountered short-term resistance at its' target of 5860 {5500 + (5500 - 5140)}, but Twiggs Money Flow (21-day) continues to hold above zero, signaling medium-term strength.
The Big Picture: The FTSE 100 is in a strong primary up-trend. Expect resistance at 6000, but the index appears to have the strength to test previous highs at 6800 in the longer term.
Japan
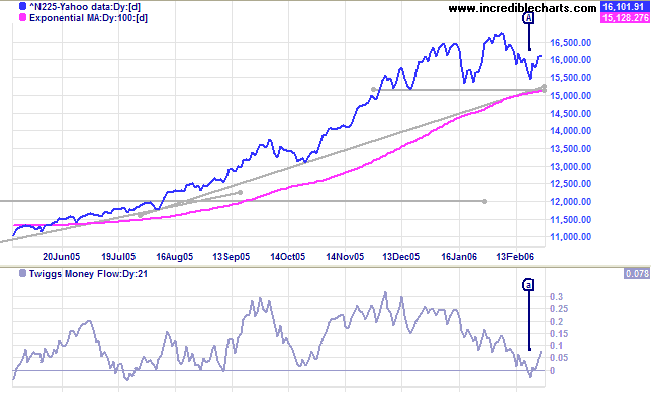
The Nikkei 225 successfully tested primary support at 15000; also respecting the long-term trendline and 100-Day exponential moving average. Twiggs Money Flow (21-day) bounced back above zero, signaling accumulation. The recent wide consolidation is likely to provide a base for further gains; though these may not be of the same magnitude as the initial breakout.
The Big Picture: The Nikkei remains in a primary up-trend.
ASX Australia
The All Ordinaries encountered strong support at 4730 and the weak correction appears near to an end -- the trendline break signaling a loss of momentum. A rise above Thursday's high of 4880 would confirm this. The weak close and strong volume at [5] indicate that the current (short-term) retracement is likely to end above last week's low of 4740 -- another positive sign.
The All Ordinaries encountered strong support at 4730 and the weak correction appears near to an end -- the trendline break signaling a loss of momentum. A rise above Thursday's high of 4880 would confirm this. The weak close and strong volume at [5] indicate that the current (short-term) retracement is likely to end above last week's low of 4740 -- another positive sign.
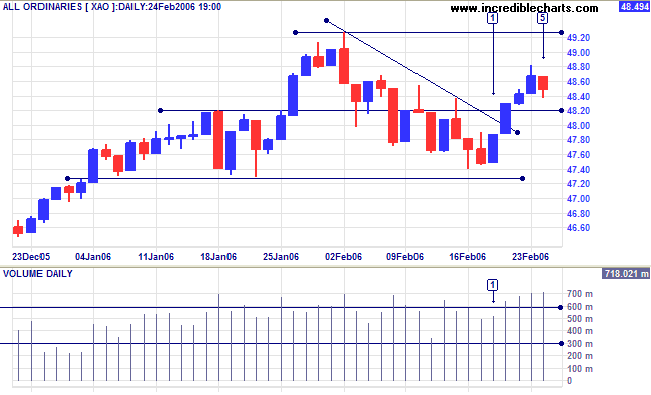
The correction is short of qualifying as a secondary correction
and the index appears headed for a test of resistance at the
previous high -- just short of its target of 4940 {4620 + (4620 -
4300)}.
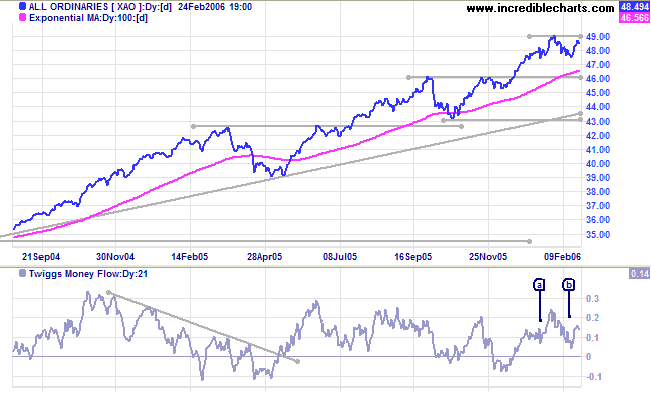
Twiggs Money Flow (21-day) formed a trough above zero at [b]: a positive sign.
Accumulation-Distribution remains positive: above its' 100-day moving average.
The Big Picture: The index continues in a strong primary up-trend.
Twiggs Money Flow (21-day) formed a trough above zero at [b]: a positive sign.
Accumulation-Distribution remains positive: above its' 100-day moving average.
The Big Picture: The index continues in a strong primary up-trend.
For further background information, read About
the Trading Diary.
Regards,
Regards,
Colin Twiggs
A good plan today is better than a perfect plan
tomorrow.
~ General George S. Patton
~ General George S. Patton

Author: Colin Twiggs is a former investment banker with almost 40 years of experience in financial markets. He co-founded Incredible Charts and writes the popular Trading Diary and Patient Investor newsletters.
Using a top-down approach, Colin identifies key macro trends in the global economy before evaluating selected opportunities using a combination of fundamental and technical analysis.
Focusing on interest rates and financial market liquidity as primary drivers of the economic cycle, he warned of the 2008/2009 and 2020 bear markets well ahead of actual events.
He founded PVT Capital (AFSL No. 546090) in May 2023, which offers investment strategy and advice to wholesale clients.