Trading Diary
February 18, 2006
These extracts from my daily trading diary are
for educational purposes and should not be interpreted as
investment advice. Full terms and conditions can be found at
Terms
of Use.
USA
The S&P 500 encountered resistance at 1290 after a strong mid-week rally. Low volume and a long tail at [1] signaled an absence of sellers, followed by a strong blue candle at [2]. The week ended quietly as traders consolidated gains before the long weekend (markets are closed for President's Day on Monday). Expect a test of resistance at 1295.
The S&P 500 encountered resistance at 1290 after a strong mid-week rally. Low volume and a long tail at [1] signaled an absence of sellers, followed by a strong blue candle at [2]. The week ended quietly as traders consolidated gains before the long weekend (markets are closed for President's Day on Monday). Expect a test of resistance at 1295.
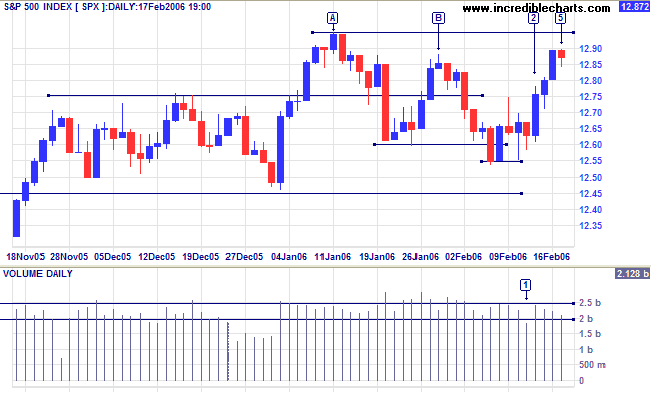
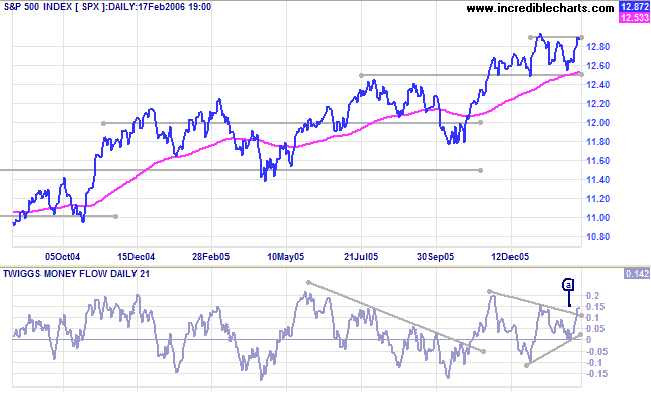
The index is testing the upper border of a 2-year bearish
rising wedge pattern.
Twiggs Money Flow (21-day) broke out above a symmetrical
triangle after completing a bullish trough above zero at [a] -- a
strong bull signal. A clear break through resistance at 1295/1300
would signal acceleration of the primary up-trend.
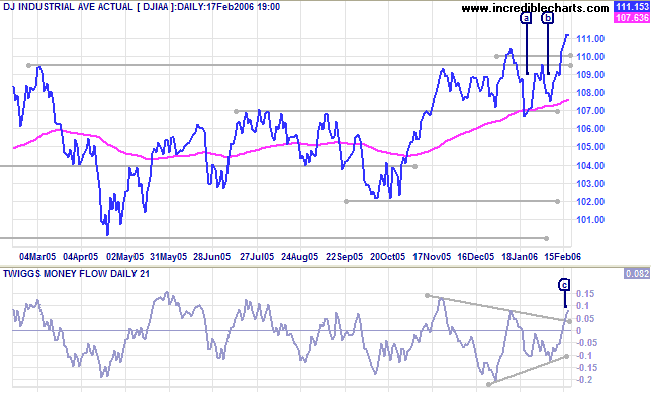
The Dow Industrial Average broke through resistance at
10950/11000 after a narrow consolidation lasting several months.
Twiggs Money Flow (21-day) breakout above the triangle at [c]
is a bullish sign. Look for a retracement of the index to test
the new support levels.
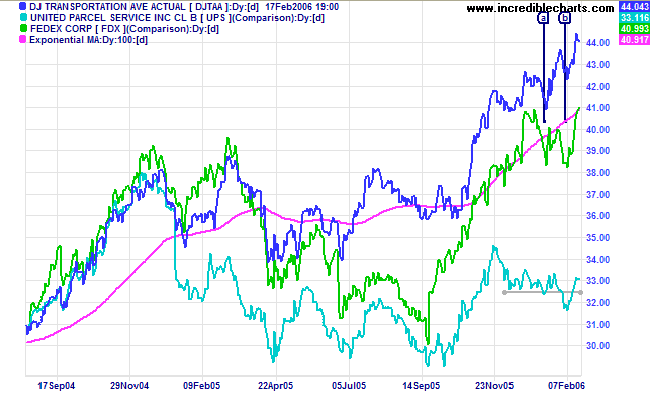
The Dow Jones Transportation Average continues in a strong
primary up-trend. Lead indicator Fedex completed a bullish double
bottom at [a] and [b] while UPS also shows signs of a recovery,
reversing above the recent resistance level.
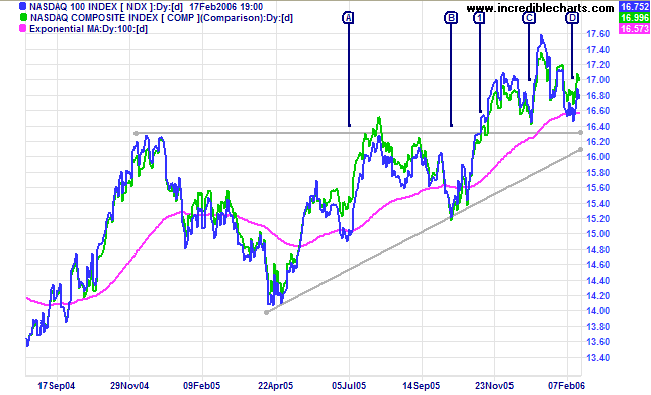
The Nasdaq 100 and Nasdaq Composite display a
series of rising lows at [A] to [C]. We now see another secondary
correction testing support at the level of the earlier highs. A
reversal of the intermediate down-trend while above the primary
support level would be a long-term bull signal for equity
markets. I have discarded the long-term bearish
rising wedge patterns because signals from the two indexes
conflict.
Treasury yields
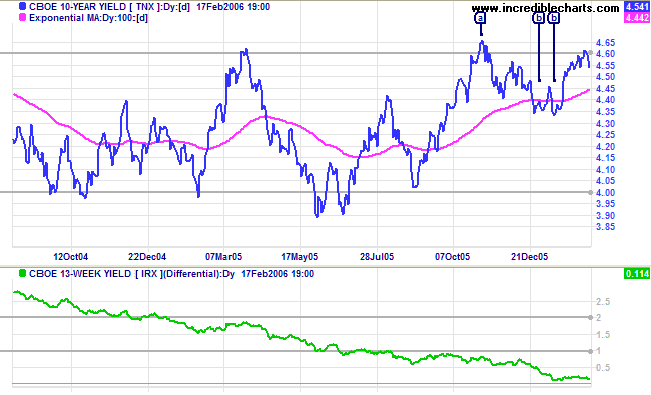
Short-term yields are rising rapidly following higher than expected core PPI figures. Rising producer prices give new Fed Chairman, Ben Bernanke, added support for further rates rises.
The 10-Year treasury yield respected resistance at 4.60/4.65%. The level of the next retracement should indicate trend strength. A breakout above the high of [a] would be a bullish sign for long-bond yields and a long-term positive for the economy, while a fall below the low of [b] would be negative. The yield differential (10-year T-notes minus 13-week T-bills) has weakened further -- a negative sign for the economy.
The Big Picture: There are promising signs on all three
equity indexes and the Dow Transport index is already in a strong
primary up-trend. Lead indicator Fedex has resumed its up-trend
while UPS also shows positive signs. The only real negative is
that short-term rates are rising faster than long-term, placing
pressure on the already flat yield curve. A negative yield curve
would make the economy vulnerable to a down-turn.
Gold
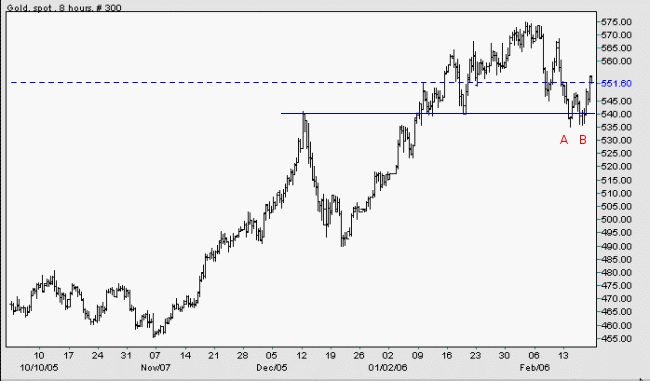
Spot gold is currently at $551.60, having successfully tested support at $540. The recent lows form a double bottom at [A] and [B], encouraging signs for a recovery, and we can expect another test of resistance at $575.
The Big Picture: Gold continues its' primary up-trend.
Spot gold is currently at $551.60, having successfully tested support at $540. The recent lows form a double bottom at [A] and [B], encouraging signs for a recovery, and we can expect another test of resistance at $575.
The Big Picture: Gold continues its' primary up-trend.
Source: Netdania
Currencies
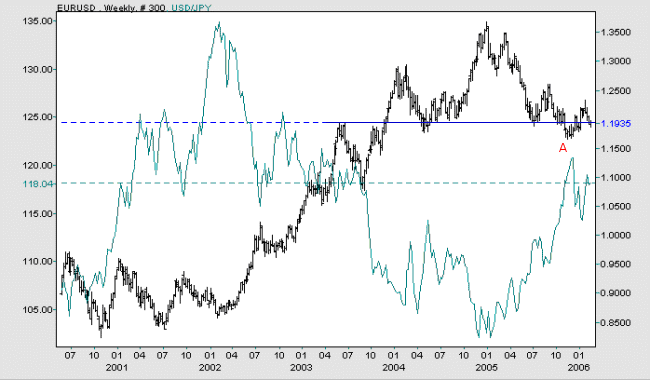
The US dollar is strengthening against both the euro and the Japanese yen. The euro has already breached primary support at [A] and a fall below the low of [A] would confirm the primary down-trend. Against the yen, the dollar appears headed for a test of 135 after respecting the new support level at 115.
The Big Picture: The dollar is strengthening against its major trade partners, a result of improved exports and rising interest rates.
Source: Netdania
United Kingdom
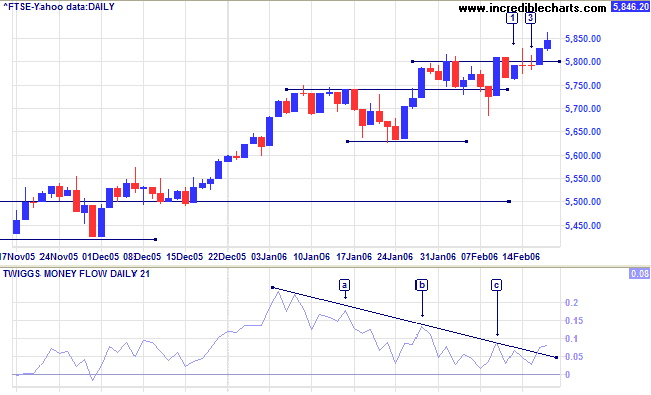
The FTSE 100 encountered solid resistance at [2] and [3] before positive performance from the US helped the index reach its target of 5860 {5500 + (5500 - 5140)}. Twiggs Money Flow (21-day) is holding above zero -- a positive sign.
The Big Picture: The primary trend is up. Expect resistance before 6000 (possibly even a secondary correction), but the index appears to have the strength to test previous highs at 6800 in the longer term.
Japan
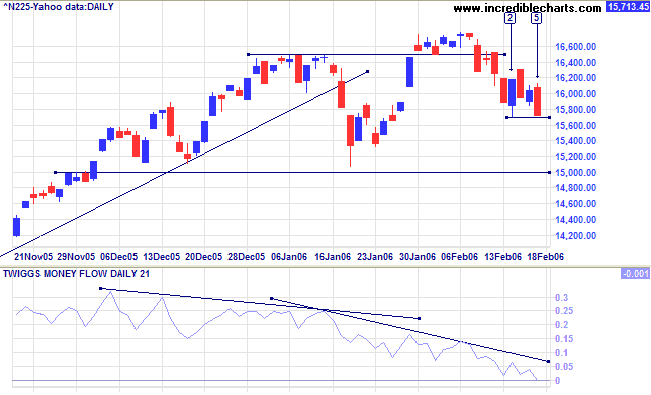
The Nikkei 225 is headed for another test of primary support at 15000 and Twiggs Money Flow (21-day) is at zero for the first time since September 2005, signaling strong distribution. If support holds, this will act as a base for further gains, but if it fails we will face a primary down-trend.
The Big Picture: The Nikkei is undergoing a secondary correction in a strong primary up-trend.
ASX Australia
After breaking through the first line of support at 4820, the All Ordinaries has edged lower while exhibiting signs of buying at [2] and [4] (a blue candle and long tail respectively, accompanied by strong volume). This promises to be a weak correction, especially if support at 4730 holds.
After breaking through the first line of support at 4820, the All Ordinaries has edged lower while exhibiting signs of buying at [2] and [4] (a blue candle and long tail respectively, accompanied by strong volume). This promises to be a weak correction, especially if support at 4730 holds.
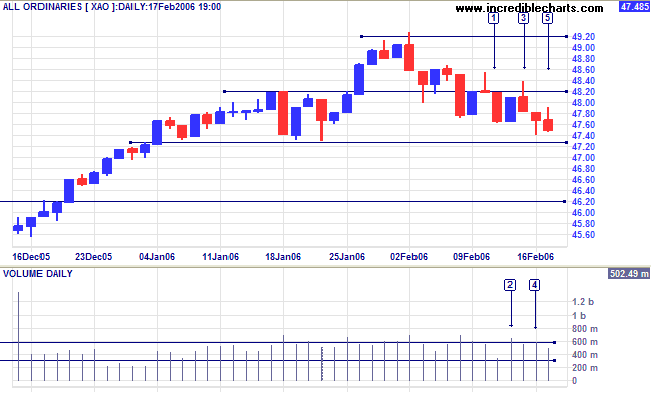
The index appears to have started a secondary correction just
short of its target of 4940 {4620 + (4620 - 4300)}. If the index
respects support at 4600, that would signal trend strength; while
failure of primary support at 4300 (unlikely in the present
circumstances) would signal a trend reversal.
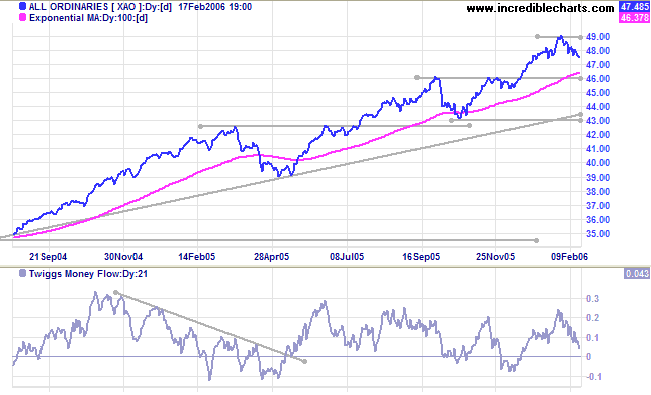
Twiggs Money Flow (21-day) is retreating, but remains above zero. A trough that respects the zero line would be a positive sign. Accumulation-Distribution continues to hold above its' 100-day moving average.
The Big Picture: The index remains in a strong primary up-trend.
Twiggs Money Flow (21-day) is retreating, but remains above zero. A trough that respects the zero line would be a positive sign. Accumulation-Distribution continues to hold above its' 100-day moving average.
The Big Picture: The index remains in a strong primary up-trend.
For further background information, read About
the Trading Diary.
Regards,
Regards,
Colin Twiggs
I don't know the key to success,
but the key to failure is trying to please everybody.
~ Bill Cosby
but the key to failure is trying to please everybody.
~ Bill Cosby

Author: Colin Twiggs is a former investment banker with almost 40 years of experience in financial markets. He co-founded Incredible Charts and writes the popular Trading Diary and Patient Investor newsletters.
Using a top-down approach, Colin identifies key macro trends in the global economy before evaluating selected opportunities using a combination of fundamental and technical analysis.
Focusing on interest rates and financial market liquidity as primary drivers of the economic cycle, he warned of the 2008/2009 and 2020 bear markets well ahead of actual events.
He founded PVT Capital (AFSL No. 546090) in May 2023, which offers investment strategy and advice to wholesale clients.