Trading Diary
February 11, 2006
These extracts from my daily trading diary are for educational
purposes and should not be interpreted as investment advice. Full
terms and conditions can be found at Terms
of Use.
USA
The S&P 500 has started a secondary correction and is headed for a test of support at 1245, after forming a lower high at [A] and lower low at [2]. One could argue that 1245 represents primary support and a close below this level would signal a primary trend reversal -- based on the 5-week consolidation in November/December -- but it is best to be cautious and treat primary support as 1170 (the October 2005 low).
The S&P 500 has started a secondary correction and is headed for a test of support at 1245, after forming a lower high at [A] and lower low at [2]. One could argue that 1245 represents primary support and a close below this level would signal a primary trend reversal -- based on the 5-week consolidation in November/December -- but it is best to be cautious and treat primary support as 1170 (the October 2005 low).
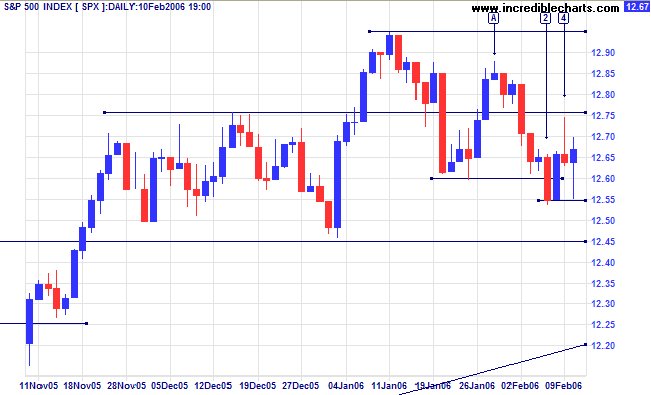
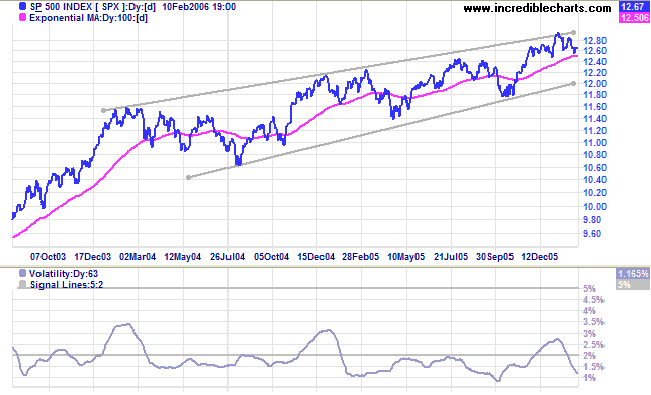
The index is consolidating in a narrow range below the upper
border of the long-term bearish
rising wedge pattern. An upward breakout from the pattern
would signal acceleration of the primary up-trend, while a
downward breakout would warn of a primary trend reversal.
Volatility remains at historically low levels (last witnessed in
1993/94 -- during the previous
short-term rate trough), while
Twiggs Money Flow (21-day) signals uncertainty.
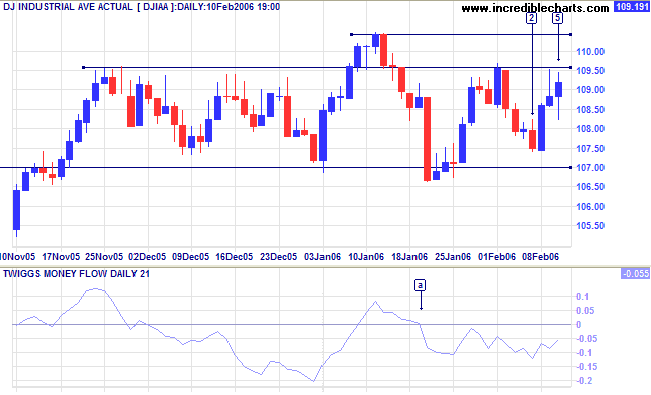
The Dow Industrial Average is testing resistance at 10950,
having been in a narrow consolidation between 10950 and 10700 for
several months. The higher low [2] is encouraging, but
Twiggs Money Flow (21-day) remains bearish -- holding below
the zero line.
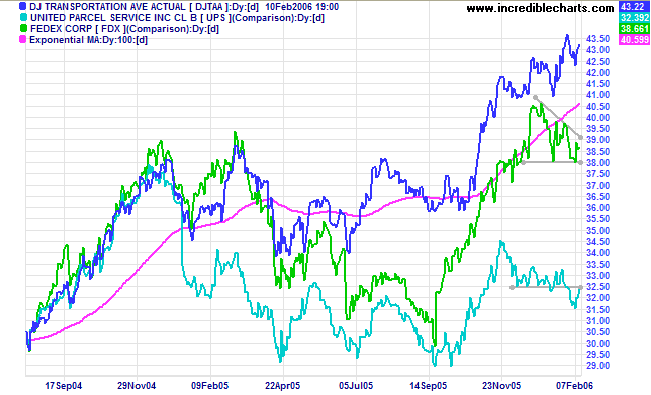
The Dow Jones Transportation Average continues in a strong
primary up-trend, but lead indicators, Fedex (descending
triangle) and UPS (reversal to a down-trend) are both bearish.
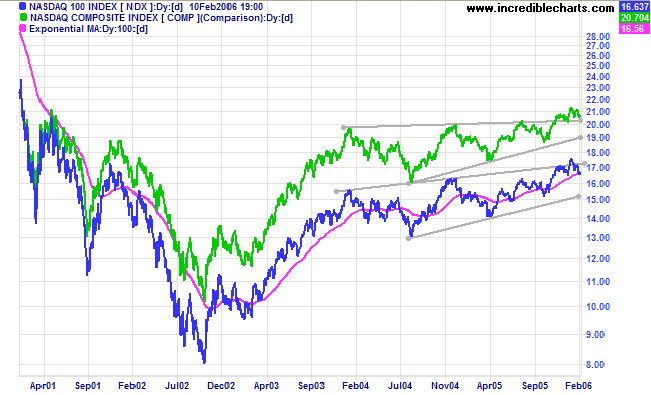
The Nasdaq 100 and Nasdaq Composite display
conflicting signals from long-term bearish
rising wedge patterns. A clear break above the upper border
would signal a stronger primary up-trend and a positive for other
US equity markets.
Treasury yields
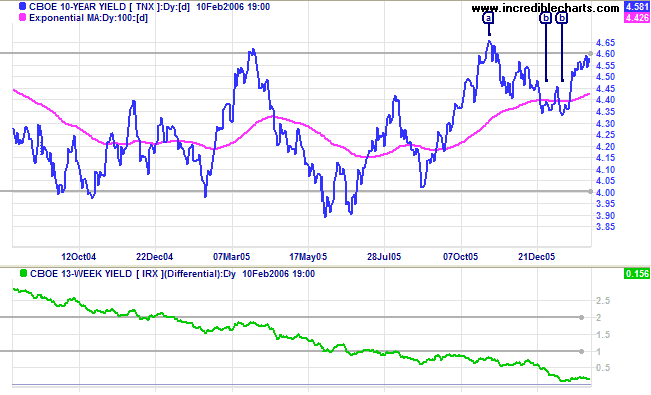
The 10-Year treasury yield is testing resistance at 4.60/4.65% after a bullish short retracement (with a double bottom at [b]). A breakout above the high of [a] would be a bullish sign for long-bond yields and a long-term positive for the economy: strengthening the weak yield differential (10-year T-notes minus 13-week T-bills).
The 10-Year treasury yield is testing resistance at 4.60/4.65% after a bullish short retracement (with a double bottom at [b]). A breakout above the high of [a] would be a bullish sign for long-bond yields and a long-term positive for the economy: strengthening the weak yield differential (10-year T-notes minus 13-week T-bills).
The Big Picture: Major equity indexes have been
consolidating for the past 2 years while interest rates were low.
The Dow Transport index displays a strong primary up-trend, but
the Fedex and UPS lead indicators are weak. Short-term rates are
rising while long-term rates may follow, easing pressure on the
flat yield curve. There are not enough positive signs yet to lift
the market out of the present doldrums.
Gold
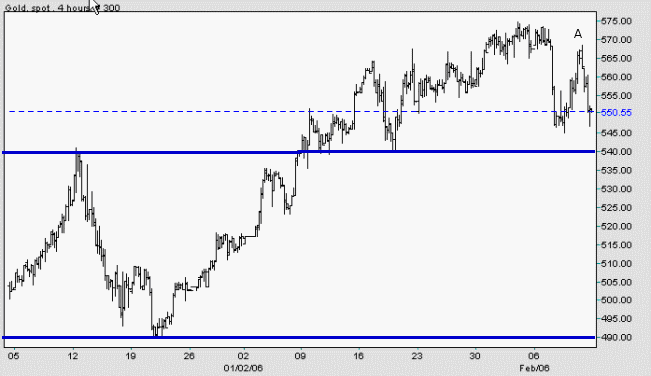
Spot gold is currently at $550.55 and headed for a test of initial support at $540 (from the December peak) after a lower high at [A]. If the metal respects this level, the strong primary up-trend will continue. However, if price falls below $540, we can expect a test of primary support at $490. The strengthening US dollar may cause a fall in demand for gold.
The Big Picture: Gold is in a primary up-trend, but stay alert for signs of weakness.
Source: Netdania
Currencies
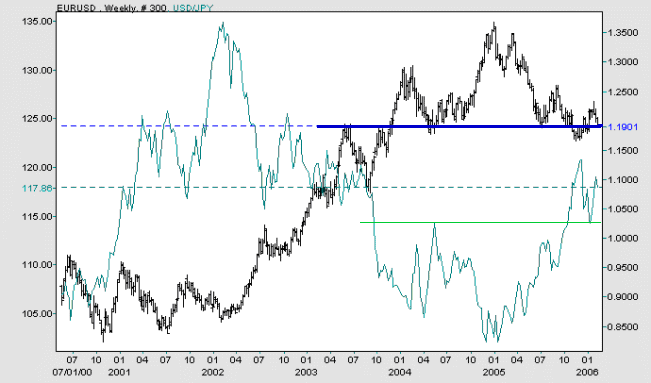
The US dollar is strengthening against both the euro and the Japanese yen. The euro is testing support at $1.20 and a fall below the November 2005 low would signal a strong down-trend. Against the yen, the dollar has successfully tested the new support level of 115 after breaking through resistance towards the end of last year.
The Big Picture: The dollar is strengthening against its major trade partners, a result of improved exports and rising interest rates.
Source: Netdania
United Kingdom
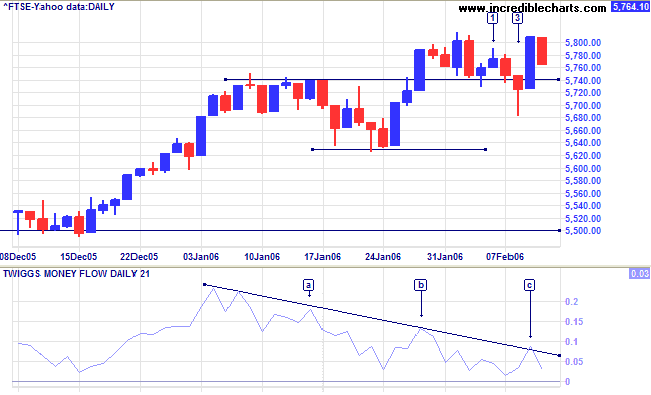
The FTSE 100 successfully tested initial support at 5740, with a long tail and strong volume at [3]. However, the index has again reversed and appears set for another test; and descending highs at [a] to [c] on Twiggs Money Flow (21-day) signal distribution.
The Big Picture: The primary trend is up, with a target of 5860 {5500 + (5500 - 5140)}, but the index is struggling to make further gains and we need to be watchful for a secondary correction.
Japan
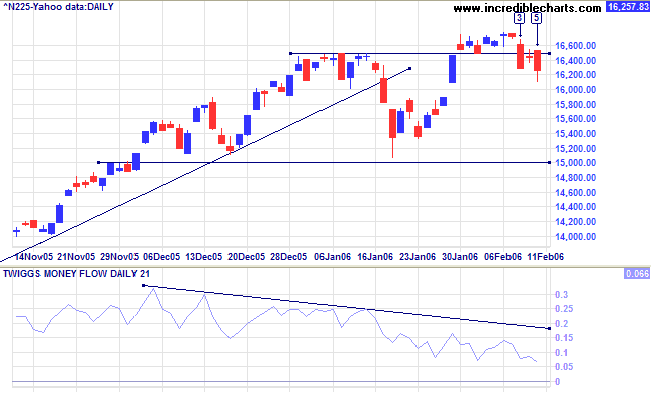
The Nikkei 225 completed a bearish false break with a retreat below initial support at 16400/16500 at [3]. The short-term recovery [4] failed and we are likely to see a test of primary support at 15000. Twiggs Money Flow (21-day) is declining, signaling (intermediate) weakness, but a long-term positive if it holds above the zero line.
The Big Picture: The Nikkei is in a strong primary up-trend with a target of 17500 { 16400 + (16400 - 15300)}.
ASX Australia
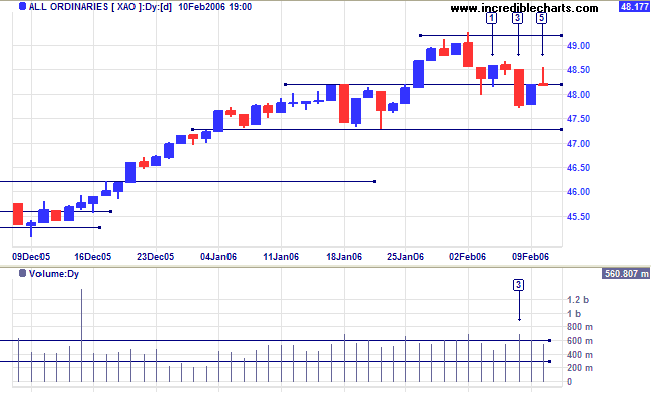
The All Ordinaries broke through the first line of (intermediate) support at 4820, the strong red candle and increased volume at [3] signaling committed sellers. The short-term retracement appears to have failed, with a very weak close at [5]. This would be confirmed if the index falls below 4780, signaling a test of primary support at 4620 and 4300, or negated if the index rises above 4850.
The All Ordinaries broke through the first line of (intermediate) support at 4820, the strong red candle and increased volume at [3] signaling committed sellers. The short-term retracement appears to have failed, with a very weak close at [5]. This would be confirmed if the index falls below 4780, signaling a test of primary support at 4620 and 4300, or negated if the index rises above 4850.
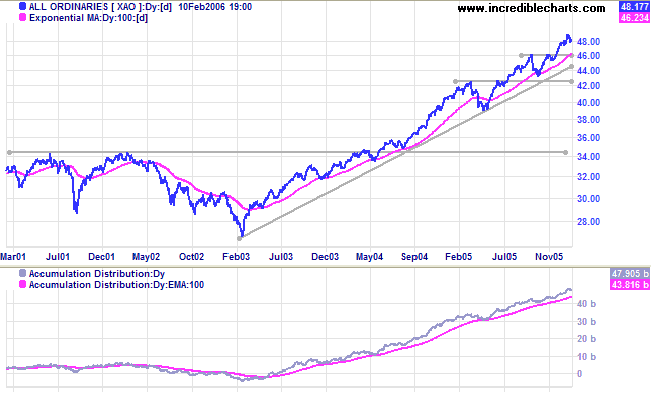
Twiggs Money Flow (21-day) is retreating, but remains above
zero. A trough that respects the zero line would be a bull
signal. Long-term
Accumulation-Distribution continues to be bullish, holding
above its' 100-day moving average.
The Big Picture: The index is in a strong primary up-trend; approaching its target of 4940 {4620 + (4620 - 4300)}.
The Big Picture: The index is in a strong primary up-trend; approaching its target of 4940 {4620 + (4620 - 4300)}.
For further background information, read About
the Trading Diary.
Regards,
Regards,
Colin Twiggs
We should consider every day lost on which we
have not danced at least once.
And we should call every truth false which was not accompanied by at least one laugh.
~ Friedrich Nietzsche
And we should call every truth false which was not accompanied by at least one laugh.
~ Friedrich Nietzsche

Author: Colin Twiggs is a former investment banker with almost 40 years of experience in financial markets. He co-founded Incredible Charts and writes the popular Trading Diary and Patient Investor newsletters.
Using a top-down approach, Colin identifies key macro trends in the global economy before evaluating selected opportunities using a combination of fundamental and technical analysis.
Focusing on interest rates and financial market liquidity as primary drivers of the economic cycle, he warned of the 2008/2009 and 2020 bear markets well ahead of actual events.
He founded PVT Capital (AFSL No. 546090) in May 2023, which offers investment strategy and advice to wholesale clients.