Trading Diary
January 28, 2006
These extracts from my daily trading diary are
for educational purposes and should not be interpreted as
investment advice. Full terms and conditions can be found at
Terms
of Use.
USA
The close below support at 1270 on the S&P 500 triggered strong buying, evidenced by narrow ranges and substantial volume. The index is headed for a test of short-term resistance at 1295, the recent high.
The close below support at 1270 on the S&P 500 triggered strong buying, evidenced by narrow ranges and substantial volume. The index is headed for a test of short-term resistance at 1295, the recent high.
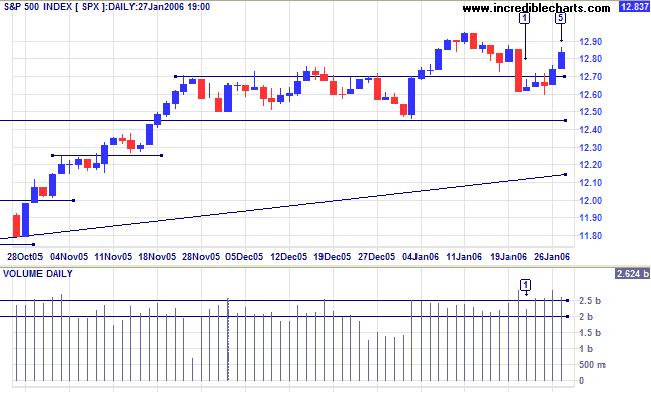
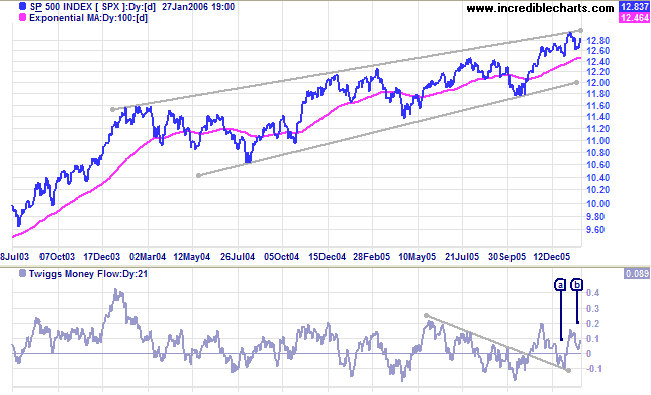
In the longer term, the index appears headed for another test of
the upper border of the long-term bearish
rising wedge pattern. An upward breakout from the pattern
would signal acceleration of the primary up-trend. A downward
breakout would signal a trend reversal.
Twiggs Money Flow (21-day) shows uncertainty, with a higher
low [b] following the recent lower high.
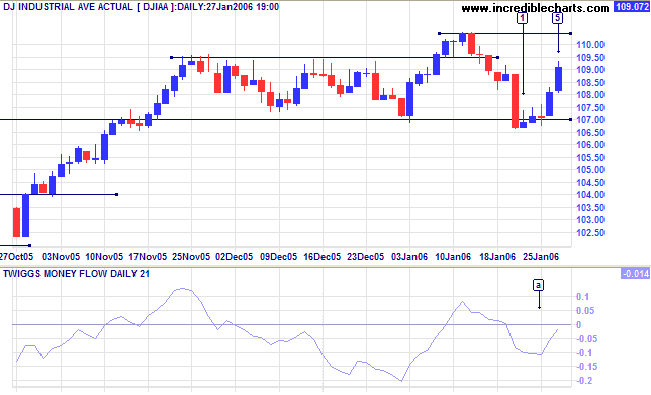
Buying support was also evident on the Dow Industrial
Average notwithstanding last weeks
close below intermediate support at 10700. The first three days
of the week showed that buyers were capable of absorbing selling
pressure: the index closed up on Monday and Tuesday despite the
tall shadows.
Twiggs Money Flow (21-day) formed a higher low, signaling
early accumulation. Expect a test of resistance at 11000/11050.
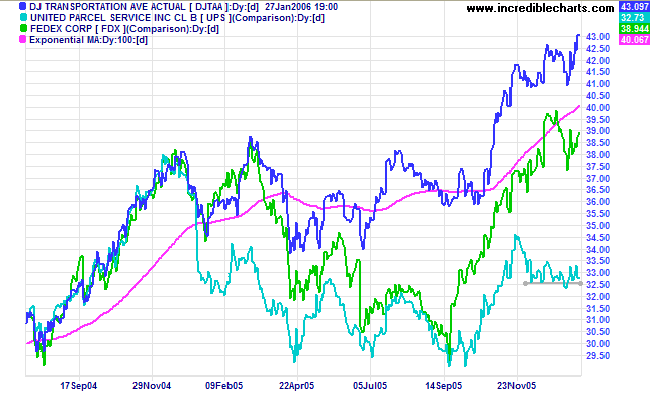
The Dow Jones Transportation Average has resumed a primary
up-trend, while Fedex and UPS have lost momentum.
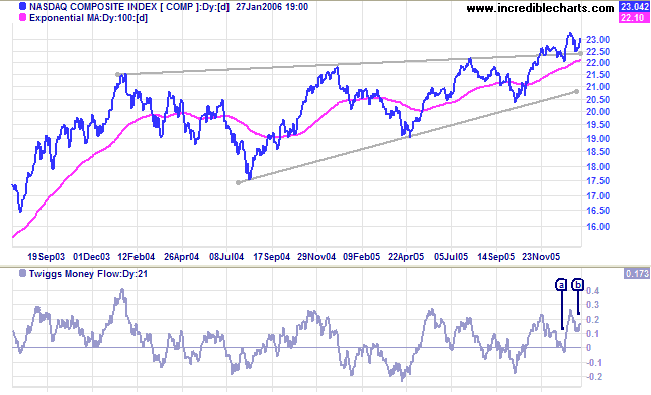
The Nasdaq Composite respected the upper border of the
long-term bearish
rising wedge pattern and appears ready to commence a stronger
primary up-trend.
Twiggs Money Flow (21-day) recorded a higher low at [b], well
above the zero line, signaling medium-term accumulation.
Treasury yields
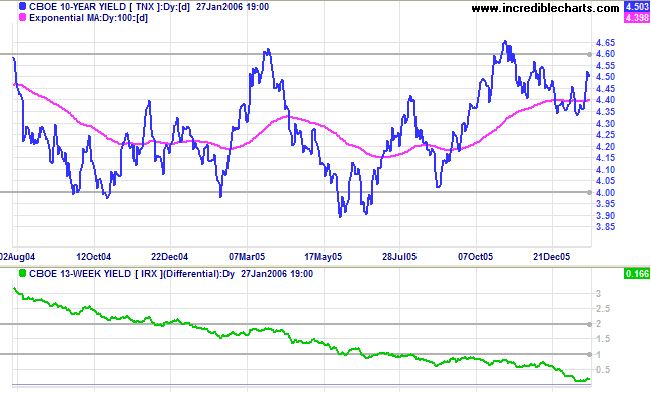
The 10-Year treasury yield is preparing for another test of resistance at 4.60%. While a breakout would result in short-term pain, it would strengthen the weak yield differential (10-year T-notes minus 13-week T-bills), a long-term positive for the economy. Otherwise, the Fed may be forced to slow short-term interest rate hikes in order to shore up the flat yield curve -- while hoping that inflation does not take root.
The 10-Year treasury yield is preparing for another test of resistance at 4.60%. While a breakout would result in short-term pain, it would strengthen the weak yield differential (10-year T-notes minus 13-week T-bills), a long-term positive for the economy. Otherwise, the Fed may be forced to slow short-term interest rate hikes in order to shore up the flat yield curve -- while hoping that inflation does not take root.
The Big Picture: The S&P500 is in a long-term rising
wedge pattern while the Dow remains range-bound between 10000 and
11000. The Nasdaq Composite index, on the other hand, is
strengthening. The Dow Transport index resumed its' primary
up-trend while the Fedex and UPS lead indicators display
medium-term weakness. The flat yield curve is a
long-term predictor of economic down-turns and is likely to weigh
heavily on the market in the next few months. The market
is making tentative advances but remains vulnerable to bad news.
Gold
New York: Spot gold continues to consolidate above support at $540, closing at $558.50 on Friday. The narrow consolidation, during a primary up-trend, is likely to resolve in a continuation of the trend.
The Big Picture: Gold is in a primary up-trend with a target of $580: 540 + (540 - 500). Increased demand signals weakness for the US dollar.
United Kingdom
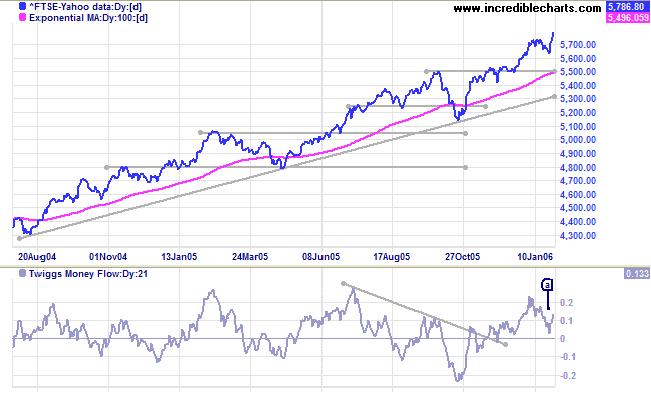
After a false break below support the FTSE 100 resumed a strong up-trend. Twiggs Money Flow (21-day) formed a low above the zero line at [a], signaling accumulation.
The Big Picture: The primary trend is up, with a target close to 6000: 5500 + (5500 - 5140) = 5860.
After a false break below support the FTSE 100 resumed a strong up-trend. Twiggs Money Flow (21-day) formed a low above the zero line at [a], signaling accumulation.
The Big Picture: The primary trend is up, with a target close to 6000: 5500 + (5500 - 5140) = 5860.
Japan
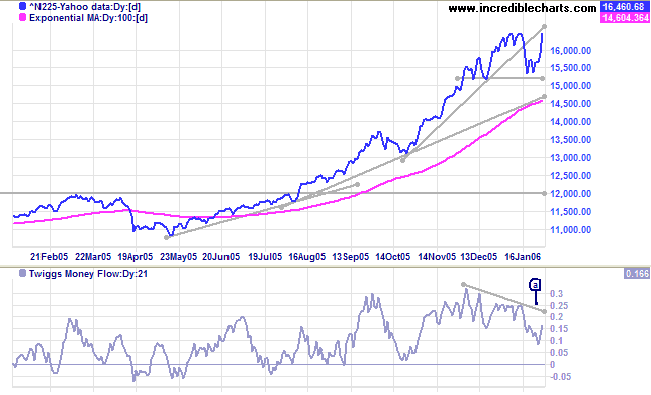
The Nikkei 225 respected support at 15200, followed by a rally to test resistance at 16400. A new high, confirmed by a retracement or consolidation that holds above 16400, would signal that the strong primary up-trend will continue. Twiggs Money Flow (21-day) formed a low above the zero line at [a] -- a possible start of further accumulation.
The Big Picture: The Nikkei is in a strong primary up-trend. The retracement to 15200 may provide a base for further gains. The target for a breakout would be 17500: 16400 + (16400 - 15300).
ASX Australia
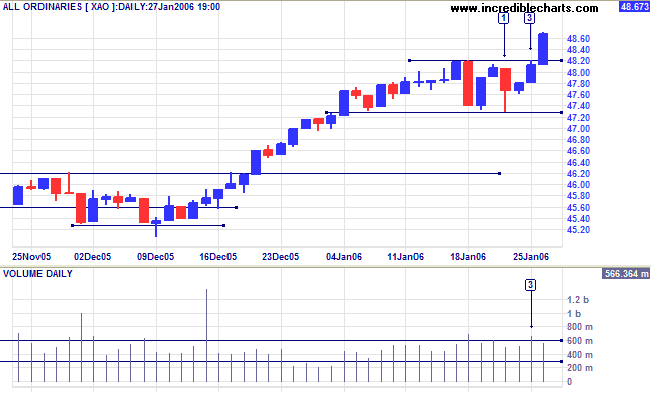
The All Ordinaries confirmed the strength of the up-trend with a strong blue candle on Friday, following a breakout above resistance at 4820. Earlier in the week the index tested support at 4730, with a long tail signaling buying strength. This was followed by increased volume at [3] as buyers encountered selling at the resistance level; the strong close again signaling buyers' commitment.
The All Ordinaries confirmed the strength of the up-trend with a strong blue candle on Friday, following a breakout above resistance at 4820. Earlier in the week the index tested support at 4730, with a long tail signaling buying strength. This was followed by increased volume at [3] as buyers encountered selling at the resistance level; the strong close again signaling buyers' commitment.
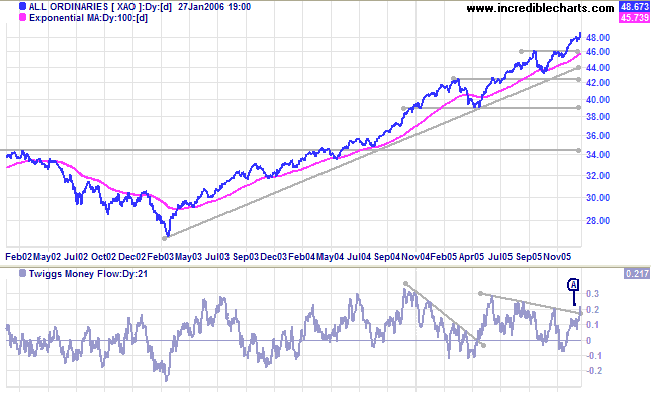
Twiggs Money Flow (21-day) rallied after a period of
consolidation above the zero line at [A]: signaling
accumulation.
The Big Picture: The index is in a strong primary up-trend with a target close to 5000: 4620 + (4620 - 4300) = 4940.
The Big Picture: The index is in a strong primary up-trend with a target close to 5000: 4620 + (4620 - 4300) = 4940.
For further background information, read About
the Trading Diary.
Regards,
Regards,
Colin Twiggs
Every man is a damn fool for at least five
minutes every day;
Wisdom consists in not exceeding that limit.
~ Elbert Hubbard
Wisdom consists in not exceeding that limit.
~ Elbert Hubbard

Author: Colin Twiggs is a former investment banker with almost 40 years of experience in financial markets. He co-founded Incredible Charts and writes the popular Trading Diary and Patient Investor newsletters.
Using a top-down approach, Colin identifies key macro trends in the global economy before evaluating selected opportunities using a combination of fundamental and technical analysis.
Focusing on interest rates and financial market liquidity as primary drivers of the economic cycle, he warned of the 2008/2009 and 2020 bear markets well ahead of actual events.
He founded PVT Capital (AFSL No. 546090) in May 2023, which offers investment strategy and advice to wholesale clients.