Trading Diary
January 21, 2006
These extracts from my daily trading diary are
for educational purposes and should not be interpreted as
investment advice. Full terms and conditions can be found at
Terms
of Use.
USA
The S&P 500 failed to respect support at 1270, falling sharply [4] on strong volume. We are likely to see a test of intermediate support at 1245.
The S&P 500 failed to respect support at 1270, falling sharply [4] on strong volume. We are likely to see a test of intermediate support at 1245.
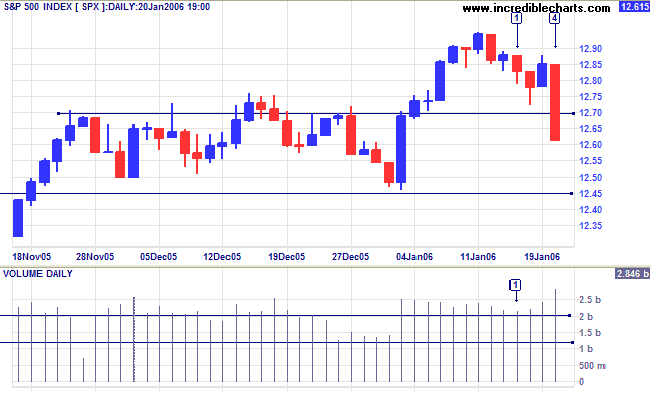
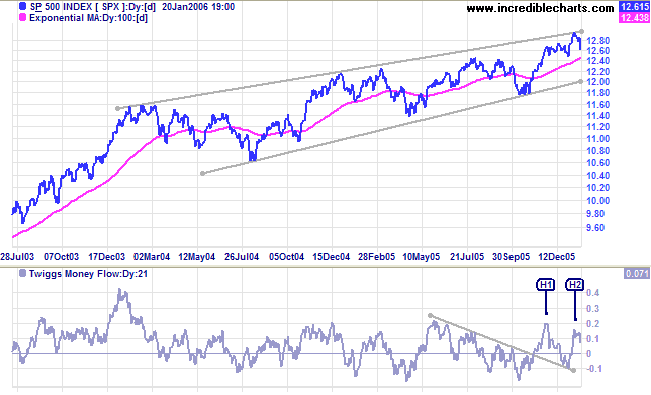
The index has returned to the long-term bearish
rising wedge pattern, signaling a slower primary up-trend. If
intermediate support at 1245 fails, we can expect a test of the
lower border of the wedge pattern. A downward breakout would have
long-term bearish consequences.
Twiggs Money Flow (21-day) has weakened with a lower high
[H2].
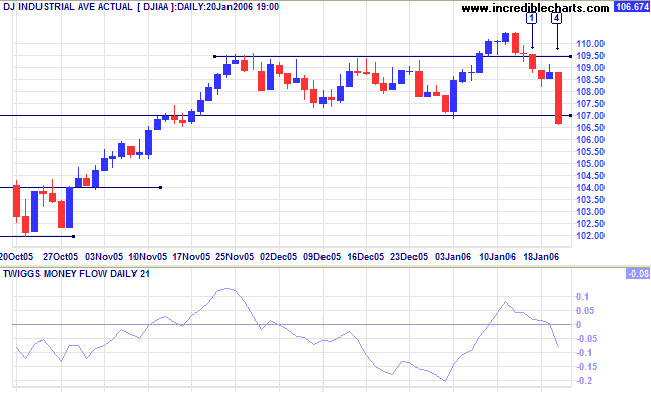
The Dow Industrial Average broke through [1] the short-term support level at 10950, followed
by a sharp fall [4] to below intermediate
support at 10700. Unless there is a reversal back above the
support level in the next few days, the index can be expected to
test long-term support at 10000.
Twiggs Money Flow (21-day) retreated back below zero,
signaling weakness.
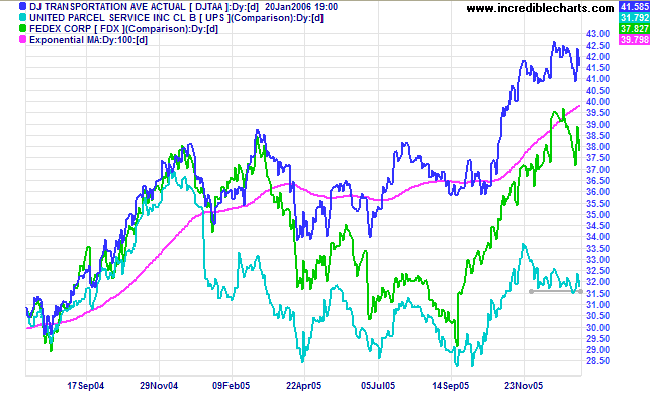
The Dow Jones Transportation Average, Fedex and UPS remain
in a primary up-trend, but appear to be losing momentum.
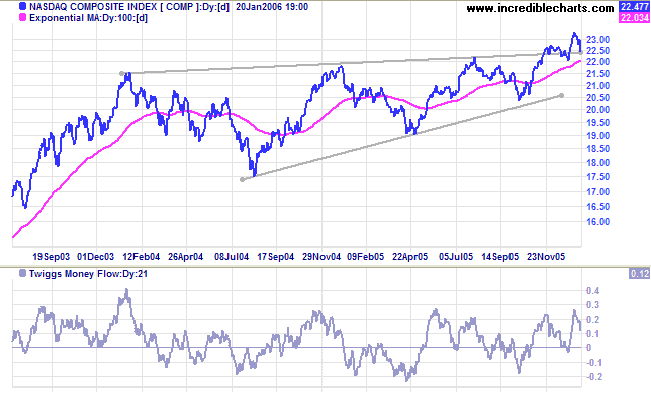
The Nasdaq Composite pulled back to test the upper border
of the long-term bearish
rising wedge pattern. A fall through this level would signal
further consolidation.
Twiggs Money Flow (21-day), however, remains positive.
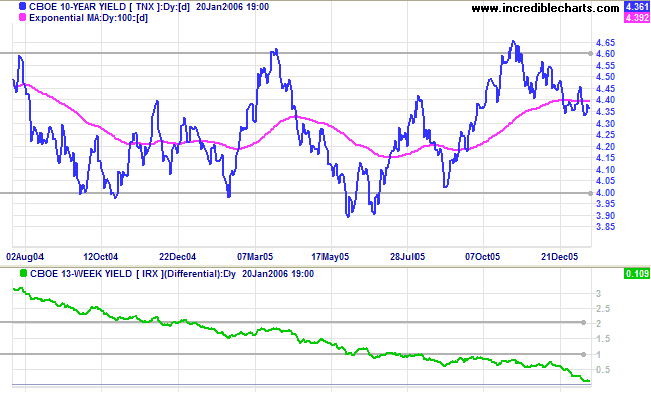
Treasury yields
Long-term yields continue to weaken, sending the yield differential (10-year T-notes minus 13-week T-bills) close to zero. This will have a negative impact on banking sector margins and is a long-term predictor of economic down-turns. The Fed may be forced to slow short-term interest rate hikes in an attempt to prevent further weakness. This may have a short-term positive effect, but later the effect of the negative yield curve can be expected to reverse this.
Long-term yields continue to weaken, sending the yield differential (10-year T-notes minus 13-week T-bills) close to zero. This will have a negative impact on banking sector margins and is a long-term predictor of economic down-turns. The Fed may be forced to slow short-term interest rate hikes in an attempt to prevent further weakness. This may have a short-term positive effect, but later the effect of the negative yield curve can be expected to reverse this.
The Big Picture: The S&P500 and NASDAQ are in
long-term consolidation patterns (rising wedges) while the Dow
remains range-bound between 10000 and 11000. The attempted
breakout in mid-January, boosted by the prospect of the Fed
slowing rate hikes, has failed. Rising transport indicators
signaled an increase in economic activity, but now appear to be
losing momentum. A negative yield curve is a
long-term predictor of economic down-turns and is likely to weigh
heavily on the market in the next few months. We appear to
be headed for a further period of consolidation.
Gold
New York: Spot gold is consolidating above support at $540, closing at $553.60 on Friday. A narrow consolidation during the primary up-trend is likely to resolve in an upward breakout.
The Big Picture: Gold is in a primary up-trend with a target of $580: 540 + (540 - 500). Increased demand signals weakness for the US dollar.
United Kingdom
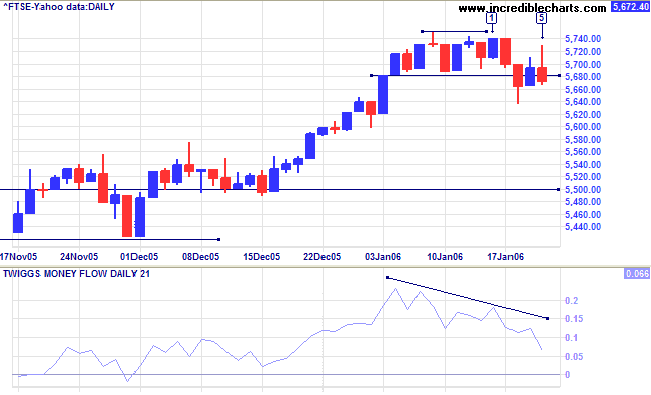
The FTSE 100 broke through intermediate support on Wednesday. The attempted recovery faded, with long shadows and strong volume at [4] and [5]. Twiggs Money Flow (21-day) is declining, signaling distribution. A test of major support at 5500 is likely if the index fails to recover above 5680 in the next few days.
The Big Picture: The primary trend is up and the current target is close to 6000: 5500 + (5500 - 5140) = 5860. A close below 5500, however, would signal trend weakness.
Japan
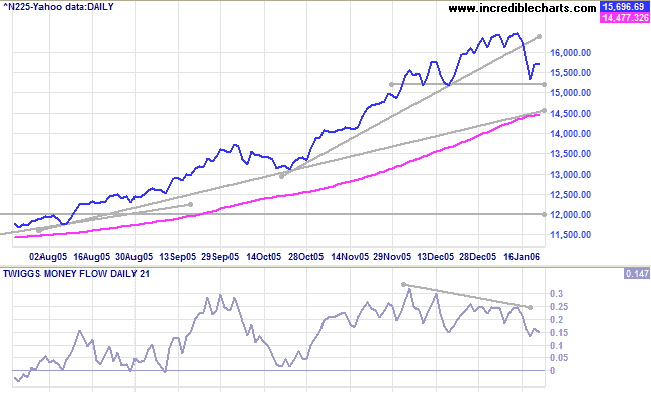
Profit-taking on the Nikkei 225 at the 16400 caused a break of the recent trendline, signaling a loss of momentum. This was exacerbated by weakness in US markets, causing a retracement to test support at 15200. If support holds, we are likely to see another rally test resistance at 16400. Twiggs Money Flow (21-day), however, is showing signs of weakening (lower highs and lows) and a fall below 15200 would signal a secondary correction, (at least) testing support at the long-term moving average.
The Big Picture: The Nikkei is in a strong primary up-trend. A secondary correction would provide a base for further gains. The index climbed a long way above the previous base at 12000 and the accelerating trend has been hinting at a blow-off.
ASX Australia
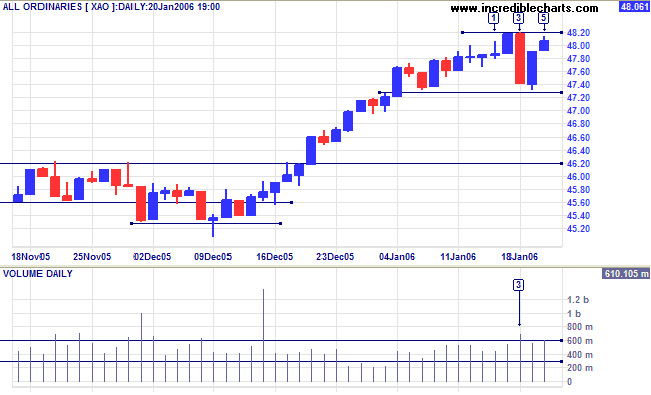
The All Ordinaries fell sharply on Wednesday, reacting to negative sentiment in US markets and the ACCC's rejection of Toll Holdings [TOL] takeover bid for Patrick [PRK]. The strong red candle warns that there may be resistance at 4820 (the previous high), while short-term support is at 4730.
The All Ordinaries fell sharply on Wednesday, reacting to negative sentiment in US markets and the ACCC's rejection of Toll Holdings [TOL] takeover bid for Patrick [PRK]. The strong red candle warns that there may be resistance at 4820 (the previous high), while short-term support is at 4730.
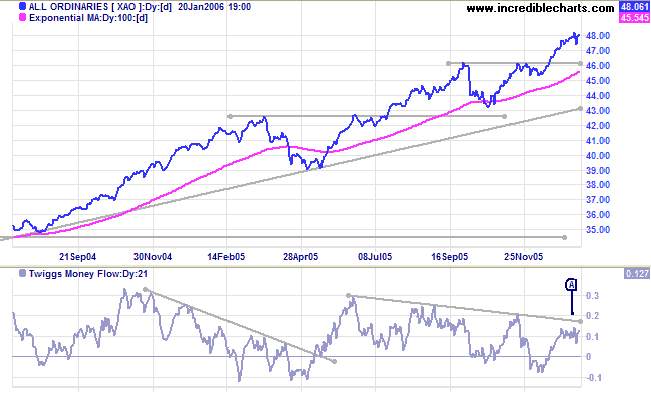
Twiggs Money Flow (21-day) continues to hold above the zero
line at [A]: a positive sign if this endures for the next few
weeks.
The Big Picture: The index is in a strong primary up-trend with a target close to 5000: 4620 + (4620 - 4300) = 4940.
The Big Picture: The index is in a strong primary up-trend with a target close to 5000: 4620 + (4620 - 4300) = 4940.
For further background information, read About
the Trading Diary.
Regards,
Regards,
Colin Twiggs
Don't be fooled by the calendar.
There are only as many days in the year as you make use of.
~ Charles Richards
There are only as many days in the year as you make use of.
~ Charles Richards

Author: Colin Twiggs is a former investment banker with almost 40 years of experience in financial markets. He co-founded Incredible Charts and writes the popular Trading Diary and Patient Investor newsletters.
Using a top-down approach, Colin identifies key macro trends in the global economy before evaluating selected opportunities using a combination of fundamental and technical analysis.
Focusing on interest rates and financial market liquidity as primary drivers of the economic cycle, he warned of the 2008/2009 and 2020 bear markets well ahead of actual events.
He founded PVT Capital (AFSL No. 546090) in May 2023, which offers investment strategy and advice to wholesale clients.