Trading Diary
December 17, 2005
These extracts from my daily trading diary are
for educational purposes and should not be interpreted as
investment advice. Full terms and conditions can be found at
Terms
of Use.
USA
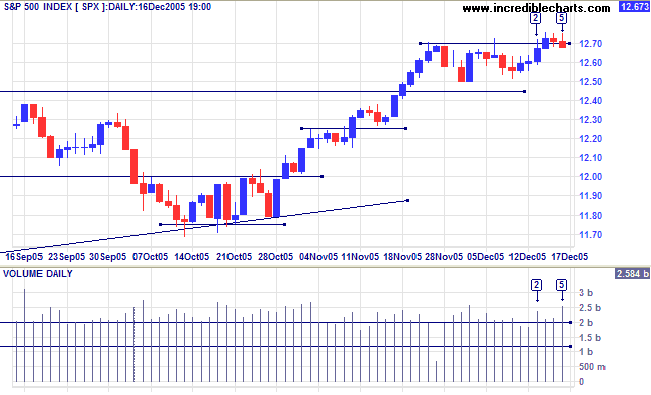
The S&P 500 is testing intermediate resistance at 1270. Strong volume and a weak close at [2] signal selling pressure, while big volume at [5] is attributable to triple-witching hour. This consolidation pattern is likely to resolve in an upward breakout; unless there is a close below support at 1250, which would signal a test of primary support at 1170.
The S&P 500 is testing intermediate resistance at 1270. Strong volume and a weak close at [2] signal selling pressure, while big volume at [5] is attributable to triple-witching hour. This consolidation pattern is likely to resolve in an upward breakout; unless there is a close below support at 1250, which would signal a test of primary support at 1170.
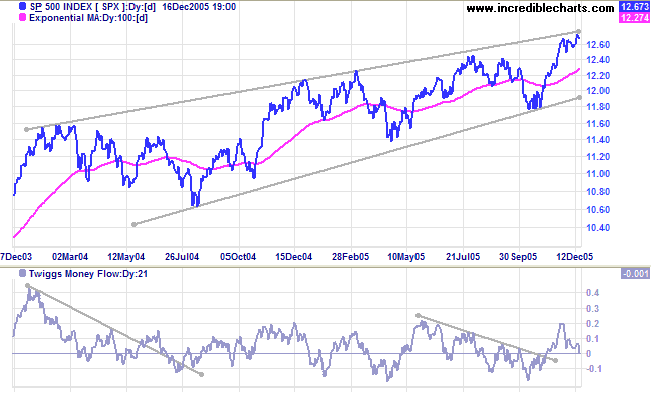
The index is consolidating below the upper border of a long-term
bearish
rising wedge pattern. A breakout would signal a stronger
primary up-trend.
Twiggs Money Flow (21-day) is close to the zero line. An
upward reversal at this point would be a bullish sign.
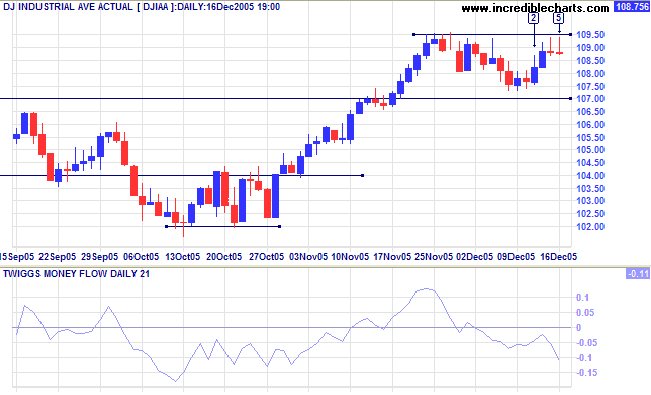
The Dow Industrial Average successfully tested support at
10700 and is now testing intermediate resistance at 10950.
Twiggs Money Flow (21-day) is negative and we can expect
another test of support at 10700 after weak closes on days [4]
and [5]. In the long-term, primary support at 10000 and
resistance at 11000 appear formidable and the index may continue
to range for some time.
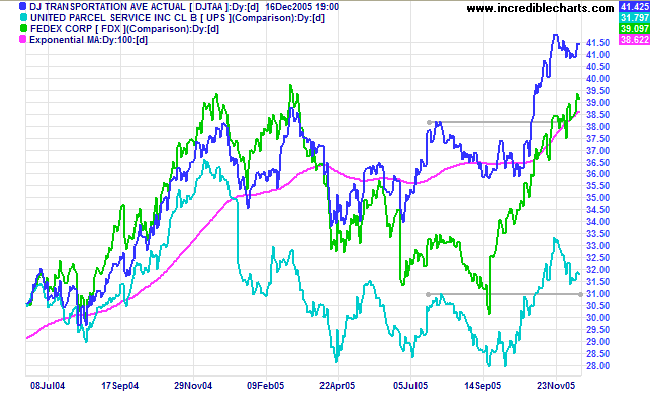
The Dow Jones Transportation Average, Fedex and UPS all
show strong primary up-trends: a positive sign for equity
markets.
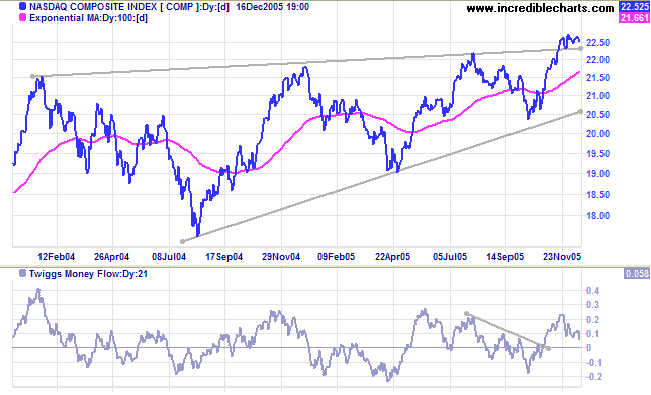
The Nasdaq Composite is consolidating above the upper
border of the bearish
rising wedge pattern: a bullish sign for equity markets.
Twiggs Money Flow (21-day) is above zero, signaling
accumulation.
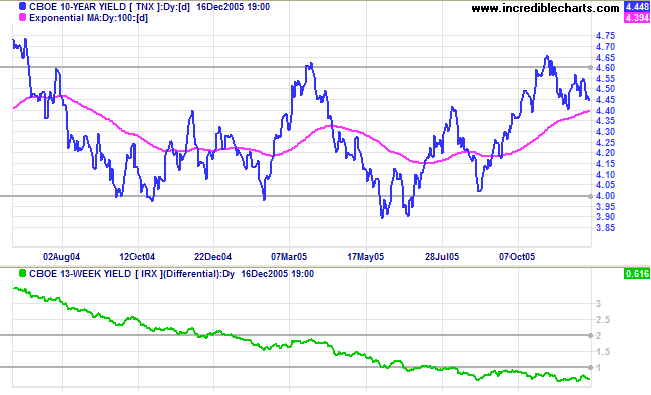
Treasury yields
The Fed delivered an early Christmas present, hinting at a slow-down in future rate hikes, while ten-year yields signal weakness, consolidating below the recent high. An improving economy is likely to place upward pressure on inflation and long-bond yields. The yield differential (10-year T-notes minus 13-week T-bills) remains low -- not a good position for the Fed if inflation starts to rise.
The Fed delivered an early Christmas present, hinting at a slow-down in future rate hikes, while ten-year yields signal weakness, consolidating below the recent high. An improving economy is likely to place upward pressure on inflation and long-bond yields. The yield differential (10-year T-notes minus 13-week T-bills) remains low -- not a good position for the Fed if inflation starts to rise.
Gold
New York: Spot gold pulled back to close $502.90 on Friday, briefly dipping below the support level on Thursday/Friday. If support at 500 holds we are likely to see a rally to around $560: 500 + (530 - 500)*2. Otherwise, look out for a test of primary support at $420.
New York: Spot gold pulled back to close $502.90 on Friday, briefly dipping below the support level on Thursday/Friday. If support at 500 holds we are likely to see a rally to around $560: 500 + (530 - 500)*2. Otherwise, look out for a test of primary support at $420.
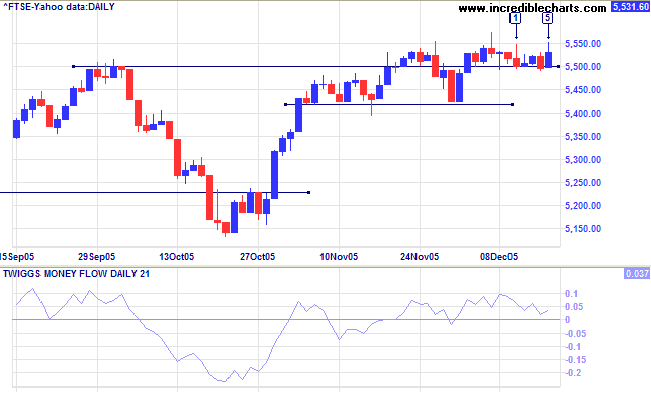
United Kingdom
The FTSE 100 is looking positive: holding above support at 5500, while Twiggs Money Flow (21-day) is holding above zero. The target for a breakout would be close to the 6000 level: 5500 + (5500 - 5140) = 5860.
The FTSE 100 is looking positive: holding above support at 5500, while Twiggs Money Flow (21-day) is holding above zero. The target for a breakout would be close to the 6000 level: 5500 + (5500 - 5140) = 5860.
Japan
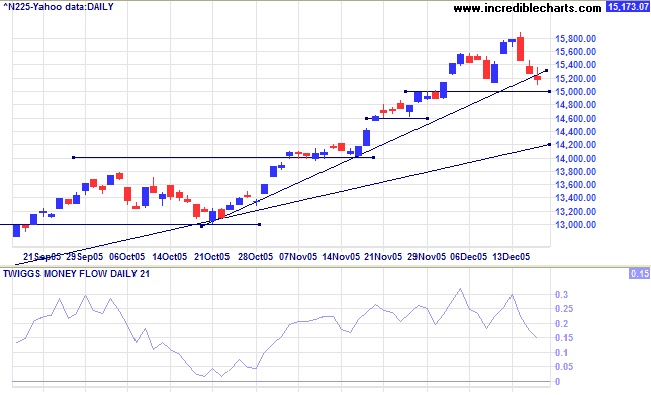
The Nikkei 225 has broken the latest trendline, signaling a loss of momentum. Expect a test of support at 15000. Consolidation above 15000 would be a positive sign for the longer term, establishing a base for further gains. Twiggs Money Flow (21-day) continues to signal strong accumulation, holding well above the zero line. The index is in a strong primary up-trend, with a long-term target of 16400: 12000 + ( 12000 - 7600 [April 2003]).
The Nikkei 225 has broken the latest trendline, signaling a loss of momentum. Expect a test of support at 15000. Consolidation above 15000 would be a positive sign for the longer term, establishing a base for further gains. Twiggs Money Flow (21-day) continues to signal strong accumulation, holding well above the zero line. The index is in a strong primary up-trend, with a long-term target of 16400: 12000 + ( 12000 - 7600 [April 2003]).
ASX Australia
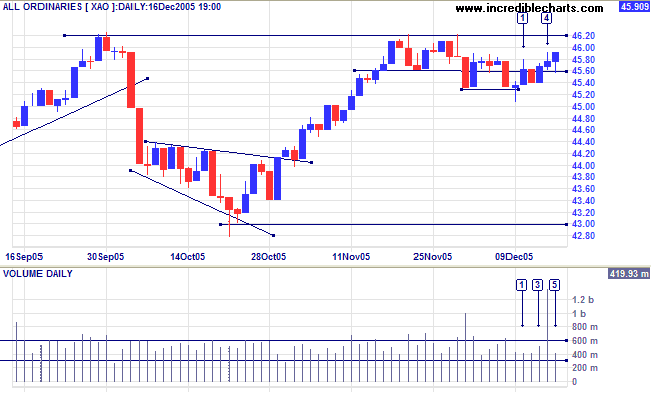
After a hesitant start to the week, the All Ordinaries has shown some resilience. A weak close at [1] followed by an inside day at [2] signal uncertainty, but the index has since rallied despite exceptional volume from the option close-out at [4] (see triple-witching hour). Expect a test of 4620. Watch for a weak pull-back, possibly respecting 4560: a bullish sign. A close below 4530, on the other hand, would be a bear signal.
After a hesitant start to the week, the All Ordinaries has shown some resilience. A weak close at [1] followed by an inside day at [2] signal uncertainty, but the index has since rallied despite exceptional volume from the option close-out at [4] (see triple-witching hour). Expect a test of 4620. Watch for a weak pull-back, possibly respecting 4560: a bullish sign. A close below 4530, on the other hand, would be a bear signal.
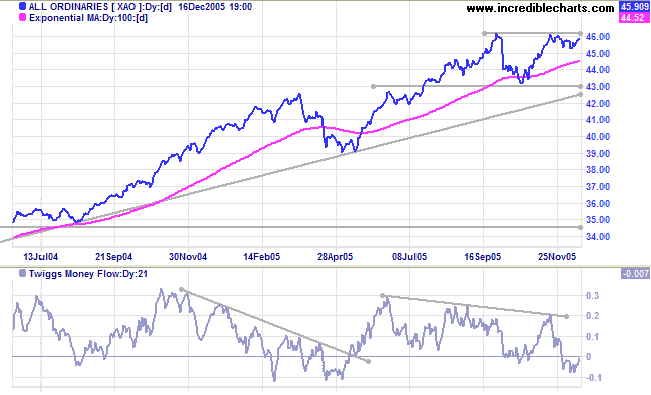
Twiggs Money Flow (21-day) is close to the zero line; not yet
displaying any significant signal.
The index is in a strong primary up-trend, with initial resistance at 4620. A breakout would present a target close to 5000: 4620 + (4620 - 4300) = 4940.
The index is in a strong primary up-trend, with initial resistance at 4620. A breakout would present a target close to 5000: 4620 + (4620 - 4300) = 4940.
This is the last trading diary for the year. The newsletter will
resume on 7th January.
Colin Twiggs

We wish all our readers peace and goodwill over
the Christmas season
and prosperity in the year ahead.
and prosperity in the year ahead.

Author: Colin Twiggs is a former investment banker with almost 40 years of experience in financial markets. He co-founded Incredible Charts and writes the popular Trading Diary and Patient Investor newsletters.
Using a top-down approach, Colin identifies key macro trends in the global economy before evaluating selected opportunities using a combination of fundamental and technical analysis.
Focusing on interest rates and financial market liquidity as primary drivers of the economic cycle, he warned of the 2008/2009 and 2020 bear markets well ahead of actual events.
He founded PVT Capital (AFSL No. 546090) in May 2023, which offers investment strategy and advice to wholesale clients.