Trading Diary
December 10, 2005
These extracts from my trading diary are for
educational purposes and should not be interpreted as investment
advice. Full terms and conditions can be found at Terms
of Use.
USA
The S&P 500 made a false break above resistance at [2], a short-term bear signal, followed by a test of support at 1250. Friday's blue candle displays a weak close; so we could see another test of 1250. If not, there will be another test of resistance at 1270. Continued consolidation in a narrow band would be bullish.
The S&P 500 made a false break above resistance at [2], a short-term bear signal, followed by a test of support at 1250. Friday's blue candle displays a weak close; so we could see another test of 1250. If not, there will be another test of resistance at 1270. Continued consolidation in a narrow band would be bullish.
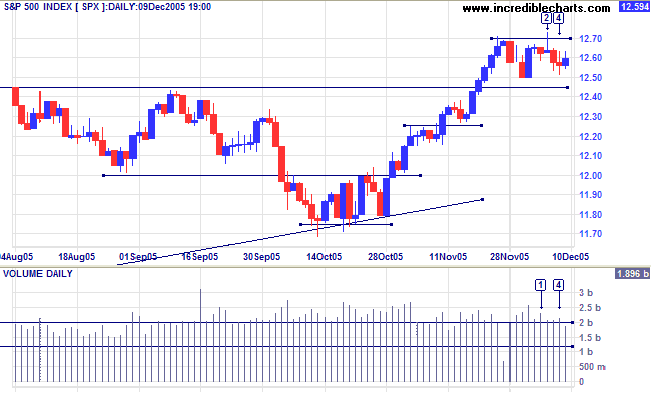
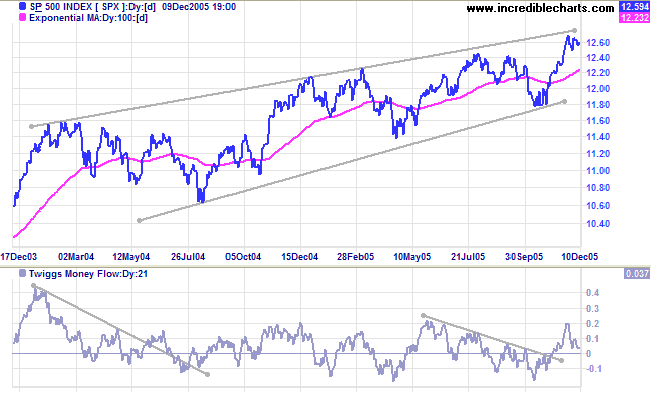
Narrow consolidation below the upper border of the long-term
bearish
rising wedge pattern is a bullish sign. A breakout above the
upper border would signal the commencement of a faster up-trend.
Twiggs Money Flow (21-day) remains in positive territory.
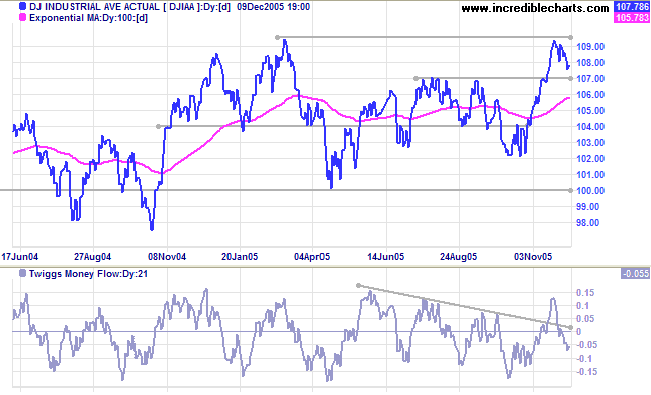
At present the Dow Industrial Average is giving clearer
signals than the S&P 500. After respecting resistance at
10950/11000 the index is headed for a test of initial support at
10700 (from the July/August highs). It will be a bullish sign if
support holds, while a close below 10700 would indicate a test of
primary support at 10000.
Twiggs Money Flow (21-day) retreated below zero, but the
indicator could be approaching a turning point: recovery from
here, to above the zero line, would complete a bullish higher
low.
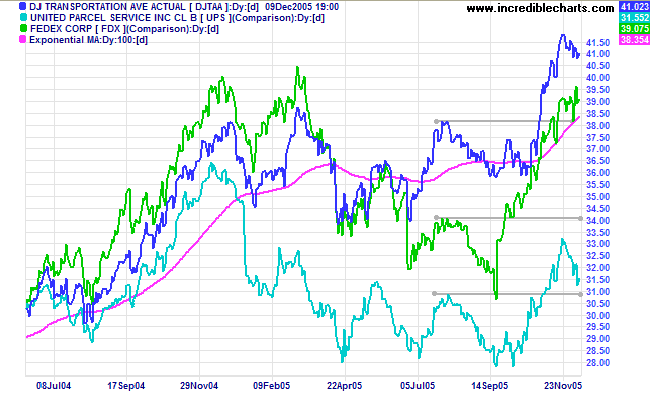
The Dow Jones Transportation Average, together with
stalwarts Fedex and UPS, is in a strong up-trend: a bull signal
for general equity markets. New highs by Fedex and UPS would
further strengthen the signal.
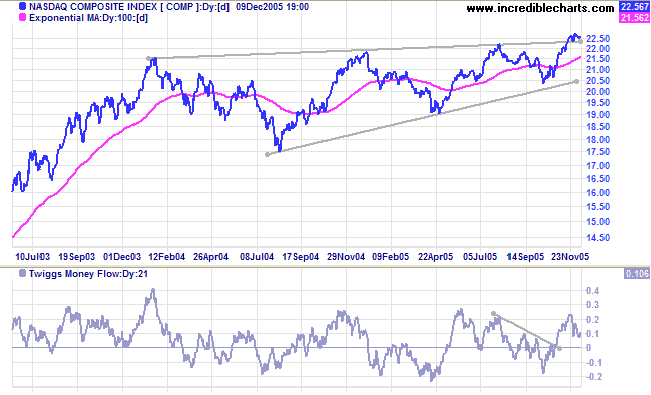
The Nasdaq Composite is consolidating above the upper
border of the long-term bearish
rising wedge pattern: a bullish sign for equity markets.
Twiggs Money Flow (21-day) signals accumulation, holding well
above zero.
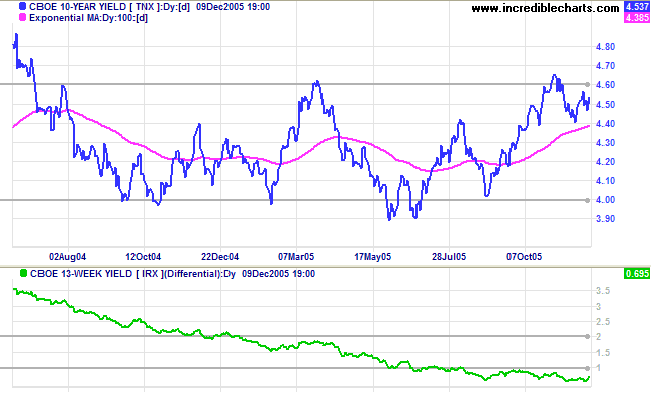
Treasury yields
Both long and short-term yields eased slightly as the market awaits the next Fed meeting. Another quarter per cent rate hike is expected, but the Fed may include a hint about slowing further increases. The yield differential (10-year T-notes minus 13-week T-bills) remains well below 1%, a bearish long-term sign for equities.
Both long and short-term yields eased slightly as the market awaits the next Fed meeting. Another quarter per cent rate hike is expected, but the Fed may include a hint about slowing further increases. The yield differential (10-year T-notes minus 13-week T-bills) remains well below 1%, a bearish long-term sign for equities.
Gold
New York: Spot gold climbed steeply to close at $526.30 on Friday. The metal is in blue sky territory, not facing much in the way of resistance, and we could see some strong rallies. Watch the accelerating curve carefully -- it can lead to a blow-off (spike) with a sharp (secondary) correction.
Rising gold prices could be a bearish sign for the US dollar, signaling a flight from the currency. This may create further incentive to continue hiking short-term rates.
United Kingdom
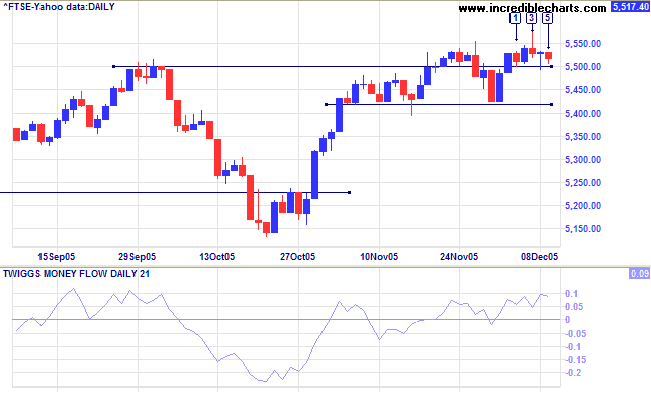
The new support level at 5500 on the FTSE 100 appears in difficulty. After encountering strong selling at [3], with a tall shadow and strong volume, the index tested the new support level towards the end of the week. Long tails at [4] and [5] show buying support, but the consolidation range (5500 to 5550) is exceedingly narrow and threatens further weakness.
A close below 5425 would signal a secondary correction, testing 5150. A close above 5550, on the other hand, would be a strong bull signal. Twiggs Money Flow (21-day) remains positive, holding above zero. The target for an upward breakout would be 5500 + (5500 - 5140) = 5860; close to the 6000 level.
Japan
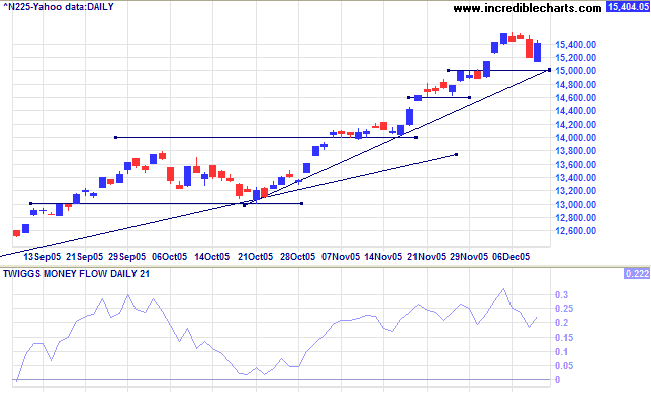
The Nikkei 225 remains the strongest of the equity markets under review. Another short correction, leaving a space above the new 15000 support level, signals continued trend strength. Twiggs Money Flow (21-day) shows strong accumulation with repeated troughs above the zero line. The long-term target is 12000 + ( 12000 - 7600 [April 2003]) = 16400.
The Nikkei 225 remains the strongest of the equity markets under review. Another short correction, leaving a space above the new 15000 support level, signals continued trend strength. Twiggs Money Flow (21-day) shows strong accumulation with repeated troughs above the zero line. The long-term target is 12000 + ( 12000 - 7600 [April 2003]) = 16400.
ASX Australia
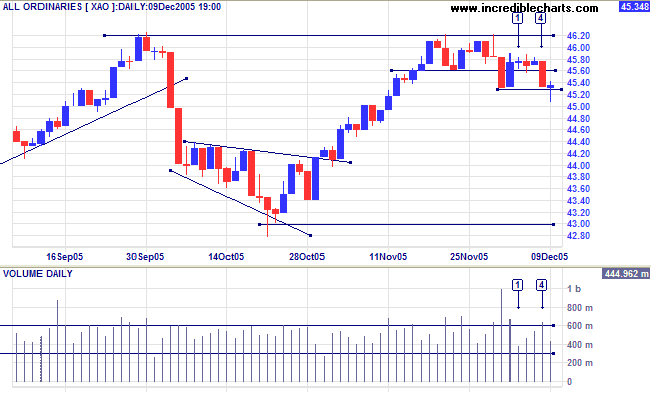
The All Ordinaries consolidated in a narrow range above support at 4560, failing to test resistance at 4620. This is a bearish signal, confirmed by the downward breakout on strong volume at [4]. Buyers returned to the market on Friday, however, completing a bullish dragonfly doji which is likely to be followed by a short-term rally.
The overall (intermediate) pattern remains bearish and failure of the next short-term rally to seriously test 4620 would be a strong bear signal, suggesting a test of primary support at 4300.
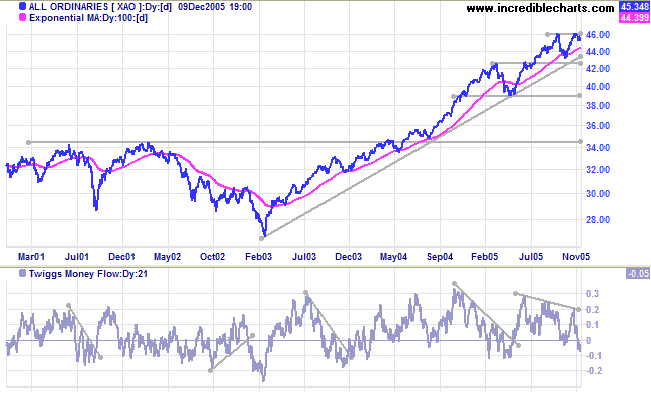
Twiggs Money Flow (21-day) trends downwards, signaling
distribution.
The index remains in a strong primary up-trend, with initial resistance at 4620 and support at 4300. A breakout above 4620 would present a target close to 5000: 4620 + (4620 - 4300) = 4940. A break below 4300, on the other hand, would signal a reversal of the primary trend.
The index remains in a strong primary up-trend, with initial resistance at 4620 and support at 4300. A breakout above 4620 would present a target close to 5000: 4620 + (4620 - 4300) = 4940. A break below 4300, on the other hand, would signal a reversal of the primary trend.
For further assistance, read About
the Trading Diary.
Colin Twiggs
You must be the change you wish to see in the
world.
~ Mahatma Gandhi
~ Mahatma Gandhi

Author: Colin Twiggs is a former investment banker with almost 40 years of experience in financial markets. He co-founded Incredible Charts and writes the popular Trading Diary and Patient Investor newsletters.
Using a top-down approach, Colin identifies key macro trends in the global economy before evaluating selected opportunities using a combination of fundamental and technical analysis.
Focusing on interest rates and financial market liquidity as primary drivers of the economic cycle, he warned of the 2008/2009 and 2020 bear markets well ahead of actual events.
He founded PVT Capital (AFSL No. 546090) in May 2023, which offers investment strategy and advice to wholesale clients.