Trading Diary
November 19, 2005
These extracts from my daily trading diary are
for educational purposes and should not be interpreted as
investment advice. Full terms and conditions can be found at
Terms
of Use.
USA
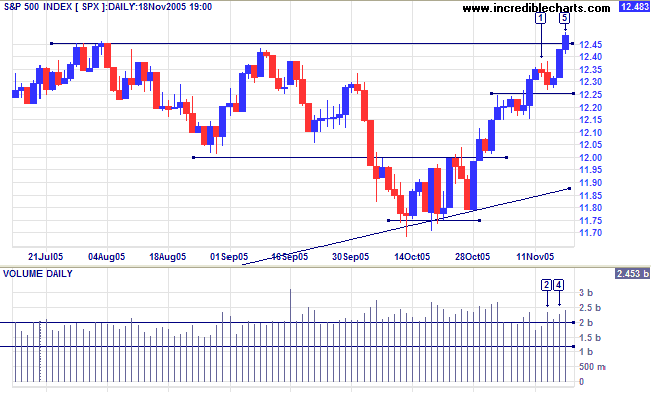
The S&P 500 broke out above resistance at 1245 to make a new 3 year high. Some profit-taking took place at [2], with a red candle and strong volume, while the tall blue candle and strong volume at [4] show buyer commitment. The index may encounter further resistance, at 1250, but this is unlikely to hold. Look for confirmation from a retracement that respects the support level.
The S&P 500 broke out above resistance at 1245 to make a new 3 year high. Some profit-taking took place at [2], with a red candle and strong volume, while the tall blue candle and strong volume at [4] show buyer commitment. The index may encounter further resistance, at 1250, but this is unlikely to hold. Look for confirmation from a retracement that respects the support level.
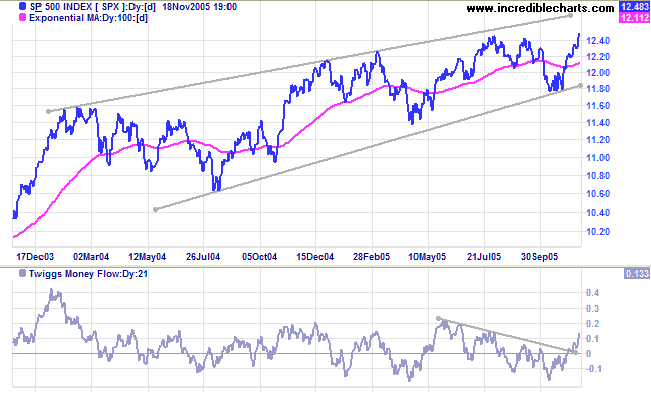
The index remains in a long-term bearish
rising wedge pattern and, unless we see a breakout above the
upper border, we should expect further consolidation.
Twiggs Money Flow (21-day) signals accumulation with a sharp
climb above the zero line.
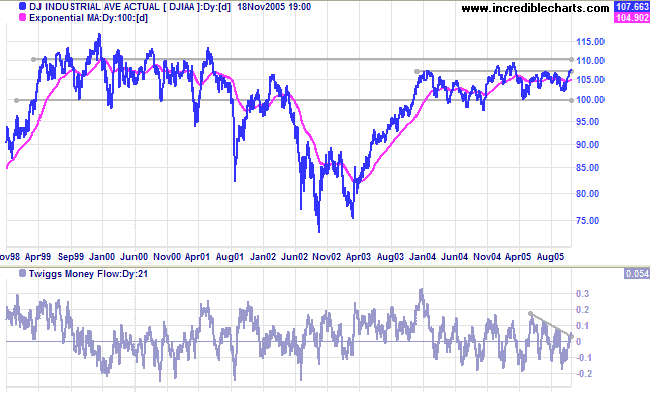
The Dow Industrial Average broke through resistance at
10700. A retracement that respects the new support level would be
a bullish sign, signaling a test of 11000.
Twiggs Money Flow (21-day) is above zero, but has yet to give
an accumulation signal. In the long-term the Dow faces heavy
resistance at 11000 and strong support at 10000.
There has been some discussion about recent changes to the Dow
Jones Transportation Average. Delta and Northwest airlines
were dropped from the index because they had filed for bankruptcy
protection. The effect is fairly negligible as the two comprised
only 1.18% of the total index weighting. However, there are also
new additions to the index:
- airline JetBlue (market cap 2.0B; weighting 2.1%), which replaces the dropped airlines;
- trucking stock Landstar [LSTR] (market cap 2.5B; weighting of 4.5%); and
- shipping stock Overseas Shipholding [OSG] (market cap 2.0B; weighting of 5.5%).
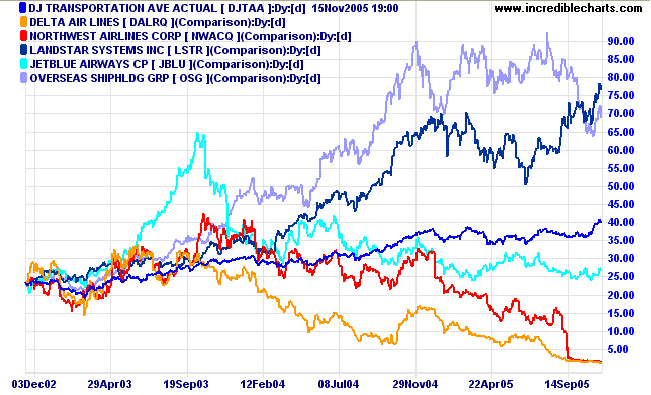
Both LSTR and OSG are positive performers and their substantial
index weightings do not seem to make sense when compared to index
stalwarts, Fedex (market cap 29.6B; index weighting 10.2%) and
UPS (market cap 86.2B; index weighting 8.2%). Frequent changes to
component stocks and weightings in an index undermine its value.
Fortunately, both UPS and Fedex are trending upwards: a bullish
sign for the economy.
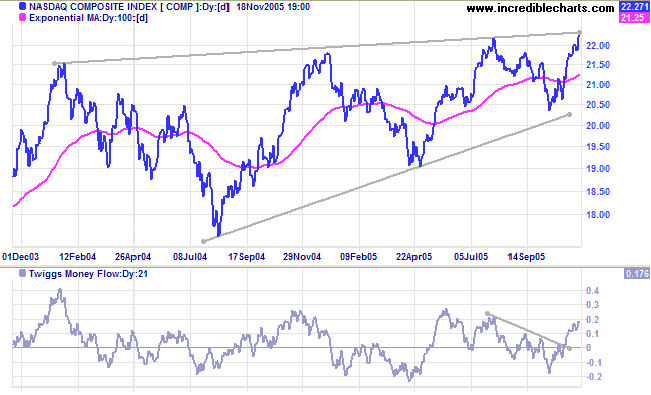
The Nasdaq Composite is testing the upper border of the
bearish
rising wedge pattern.
Twiggs Money Flow (21-day) signals accumulation, climbing
steeply above zero. A breakout would signal a strong primary
up-trend: a positive sign for the Dow and S&P 500.
Treasury yields
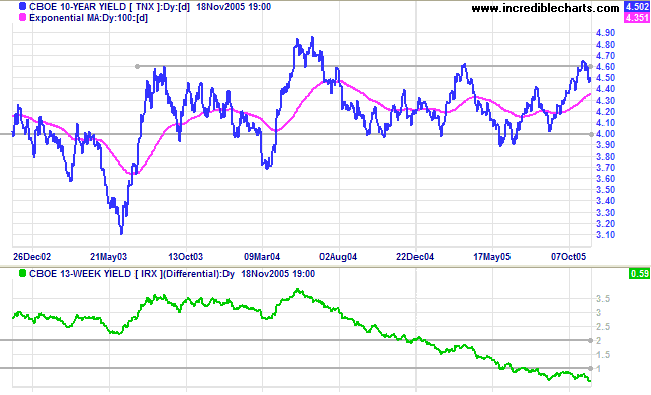
Short-term yields are rising while long-term yields have pulled back below resistance at 4.60%. The yield differential (10-year T-notes minus 13-week T-bills) fell to 0.59%. The Fed continues to face a tough choice: continue to hike short-term rates and the yield curve will go negative, but ease off the rate hikes and inflation may take root. Either result will have negative consequences.
Short-term yields are rising while long-term yields have pulled back below resistance at 4.60%. The yield differential (10-year T-notes minus 13-week T-bills) fell to 0.59%. The Fed continues to face a tough choice: continue to hike short-term rates and the yield curve will go negative, but ease off the rate hikes and inflation may take root. Either result will have negative consequences.
Gold
New York: Resistance at the upper border of the consolidation is broken and spot gold appears headed for a test of resistance at $500, closing at $485.20 on Friday. The earlier downward breakout proved to be a classic bear trap.
New York: Resistance at the upper border of the consolidation is broken and spot gold appears headed for a test of resistance at $500, closing at $485.20 on Friday. The earlier downward breakout proved to be a classic bear trap.
United Kingdom
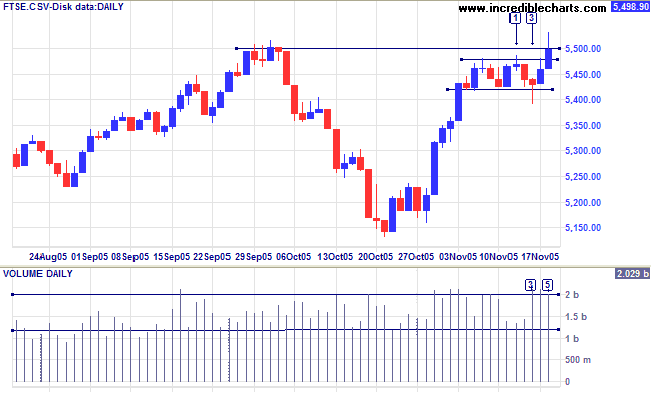
The FTSE 100 made a false break below support at 5420 on Wednesday (note the long tail and strong volume at [3]) before rallying towards the end of the week. Long shadows and big volume on Thursday/Friday signal strong selling and the failed breakout at [5] has bearish implications: expect another test of support at 5420. Twiggs Money Flow (21-day) is neutral, sitting at the zero line. There are two probable longer-term scenarios:
The FTSE 100 made a false break below support at 5420 on Wednesday (note the long tail and strong volume at [3]) before rallying towards the end of the week. Long shadows and big volume on Thursday/Friday signal strong selling and the failed breakout at [5] has bearish implications: expect another test of support at 5420. Twiggs Money Flow (21-day) is neutral, sitting at the zero line. There are two probable longer-term scenarios:
- a fall below short-term support at 5420 leading to a test of primary support at 5140;
- a breakout above 5500, with a target close to 6000: 5500 + (5500 - 5140) = 5860.
Japan
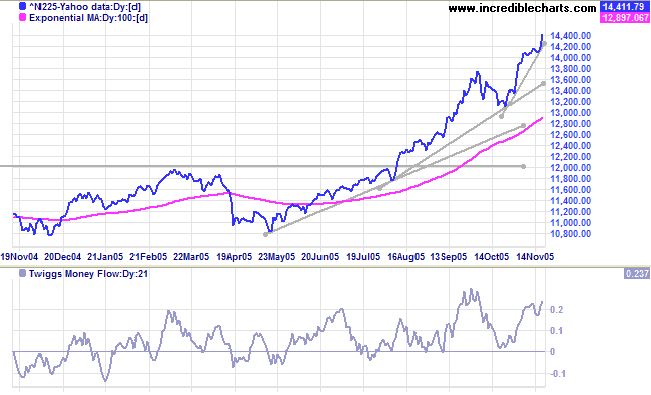
The Nikkei 225 has again commenced an accelerating curve. Accelerating trends are unsustainable and -- though we may see strong gains first -- allow for a correction back to the intermediate trendline. The bottom line is: tighten your stops in an accelerating curve. Twiggs Money Flow (21-day) signals strong accumulation. The primary up-trend should continue for some time, with a long-term target of 16400: 12000 + ( 12000 - 7600 [April 2003]) = 16400.
The Nikkei 225 has again commenced an accelerating curve. Accelerating trends are unsustainable and -- though we may see strong gains first -- allow for a correction back to the intermediate trendline. The bottom line is: tighten your stops in an accelerating curve. Twiggs Money Flow (21-day) signals strong accumulation. The primary up-trend should continue for some time, with a long-term target of 16400: 12000 + ( 12000 - 7600 [April 2003]) = 16400.
ASX Australia
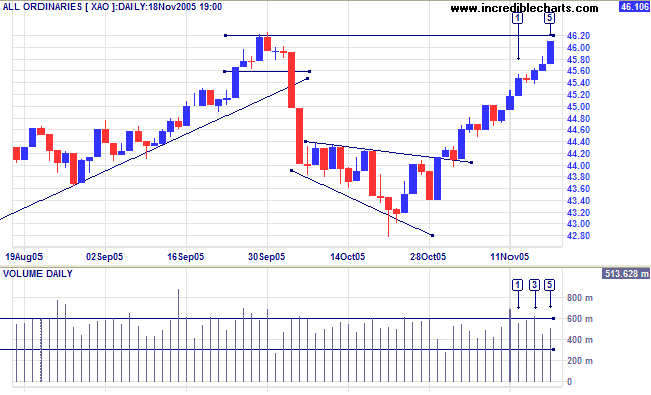
The All Ordinaries encountered some profit-taking during the week, with a doji on Tuesday, increased volume and a narrow range on Wednesday [3] and tall shadow on Thursday. Friday's strong blue candle [5], however, confirms that the market is still bullish and we can expect a strong test of resistance at 4620.
The All Ordinaries encountered some profit-taking during the week, with a doji on Tuesday, increased volume and a narrow range on Wednesday [3] and tall shadow on Thursday. Friday's strong blue candle [5], however, confirms that the market is still bullish and we can expect a strong test of resistance at 4620.
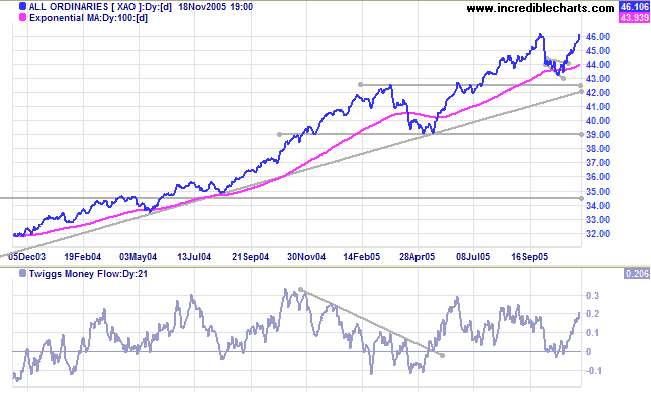
Twiggs Money Flow (21-day) signals accumulation and the index
is in a strong primary up-trend. A breakout above 4620 would
present a target close to 5000: 4620 + (4620 - 4300) = 4940. On
the other hand, though it appears unlikely, failure to break
above the previous high would signal a test of primary support at
4320.
For further assistance, read About
the Trading Diary.
Colin Twiggs
Genius is only the power of making continuous
efforts.
The line between failure and success is so fine that we scarcely know when we pass it;
so fine that we are often on the line and do not know it.
~ Elbert Hubbard
The line between failure and success is so fine that we scarcely know when we pass it;
so fine that we are often on the line and do not know it.
~ Elbert Hubbard

Author: Colin Twiggs is a former investment banker with almost 40 years of experience in financial markets. He co-founded Incredible Charts and writes the popular Trading Diary and Patient Investor newsletters.
Using a top-down approach, Colin identifies key macro trends in the global economy before evaluating selected opportunities using a combination of fundamental and technical analysis.
Focusing on interest rates and financial market liquidity as primary drivers of the economic cycle, he warned of the 2008/2009 and 2020 bear markets well ahead of actual events.
He founded PVT Capital (AFSL No. 546090) in May 2023, which offers investment strategy and advice to wholesale clients.