Trading Diary
November 05, 2005
These extracts from my daily trading diary are
for educational purposes and should not be interpreted as
investment advice. Full terms and conditions can be found at
Terms
of Use.
USA
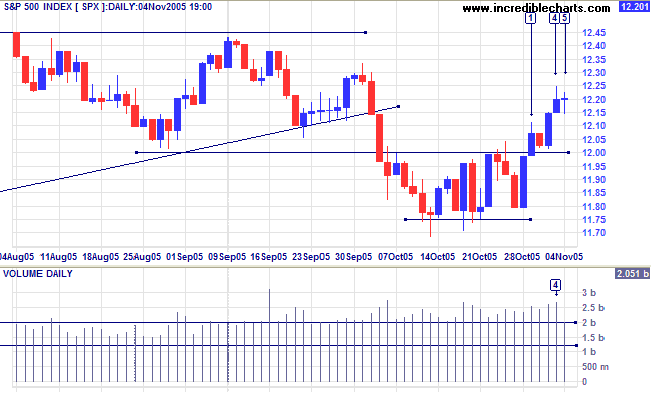
The S&P 500 closed above 1200 at [1]; signaling an end to the recent secondary correction. The short reaction on Tuesday is a bullish sign, but the latest rally encountered resistance at [4], evident from the tall shadow and strong volume. Friday's dragonfly doji is likely to resolve in a continuation of the intermediate up-trend.
The S&P 500 closed above 1200 at [1]; signaling an end to the recent secondary correction. The short reaction on Tuesday is a bullish sign, but the latest rally encountered resistance at [4], evident from the tall shadow and strong volume. Friday's dragonfly doji is likely to resolve in a continuation of the intermediate up-trend.
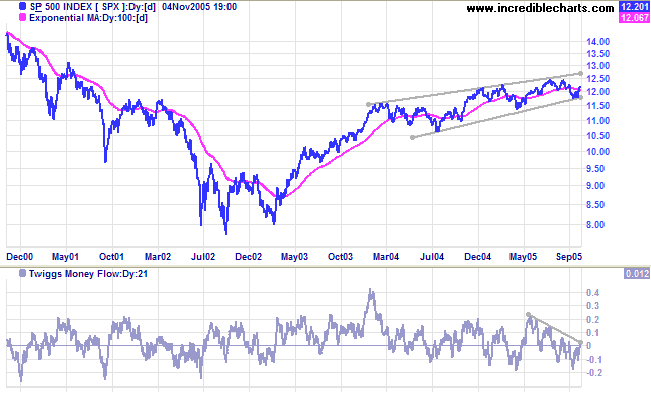
We are not yet out of the woods: the primary up-trend is weak and
the index remains in a long-term bearish
rising wedge pattern. The present rally is likely to test the
upper border of the pattern, while a close back below 1200,
though unlikely at present, would indicate that primary support
at 1140 is under threat.
Twiggs Money Flow (21-day) completed a medium-term bullish
divergence, but remains close to the zero line.
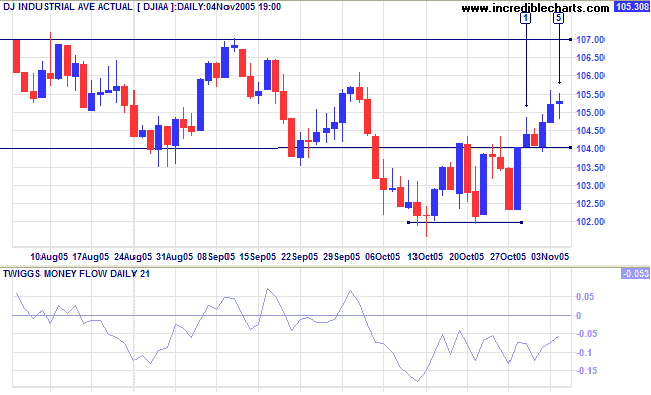
The Dow Industrial Average performed in a similar fashion
to the S&P 500 over the last week.
Twiggs Money Flow (21-day) displays a medium-term bullish
divergence and we can expect a test of 10700. In the long-term,
the Dow is likely to range between 10000 and 11000 for some time,
restraining advances on other indices.
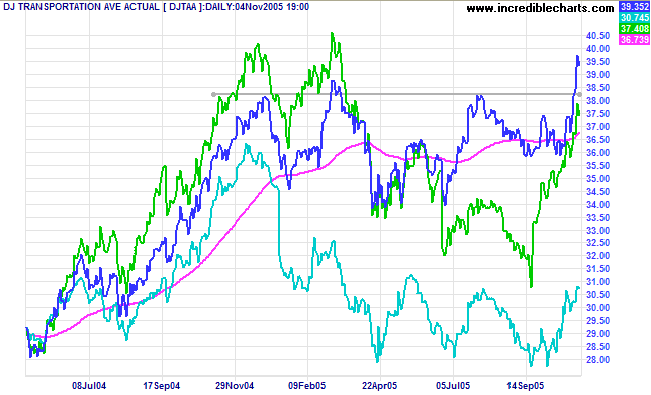
The Dow Jones Transportation Average has followed Fedex
into a strong primary up-trend, with a rise to a new 10-year
high. This augurs well for the broader equities market. A
pull-back that respect support at 3825 would confirm the
breakout. UPS appears set to follow, with a short retracement
below the resistance level.
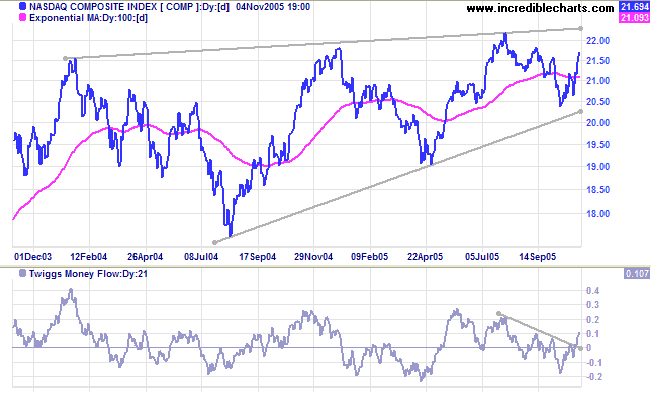
The Nasdaq Composite respected the lower border of the
bearish
rising wedge pattern and is climbing steeply.
Twiggs Money Flow (21-day) signals accumulation, climbing
sharply above zero. Expect a test of the upper border of the
rising wedge pattern, with a possible breakout to a strong
primary up-trend.
Treasury yields
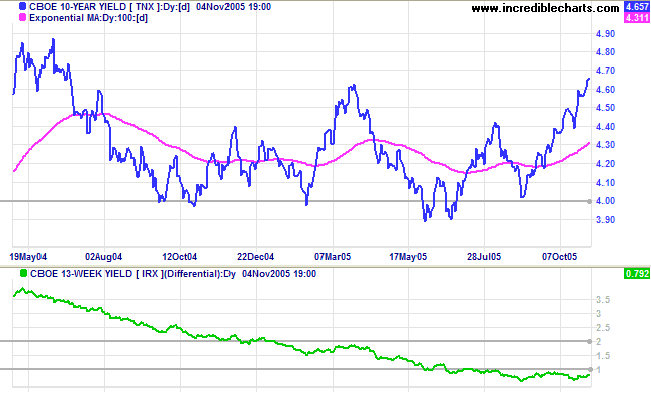
An improving economy is likely to place upward pressure on inflation and long-bond yields. Both long and short-term yields are rising, maintaining a yield differential (10-year T-notes minus 13-week T-bills) below 1.0%: a bear signal for equity markets in about 12 months time.
An improving economy is likely to place upward pressure on inflation and long-bond yields. Both long and short-term yields are rising, maintaining a yield differential (10-year T-notes minus 13-week T-bills) below 1.0%: a bear signal for equity markets in about 12 months time.
Gold
New York: Spot gold fell to $456.20 on Friday. The breakout below support at $460, from the last 6 week's consolidation, is a bear signal for the metal (and a positive sign for the US currency/economy). Look out for a test of support at $450 and possibly $430.
New York: Spot gold fell to $456.20 on Friday. The breakout below support at $460, from the last 6 week's consolidation, is a bear signal for the metal (and a positive sign for the US currency/economy). Look out for a test of support at $450 and possibly $430.
United Kingdom
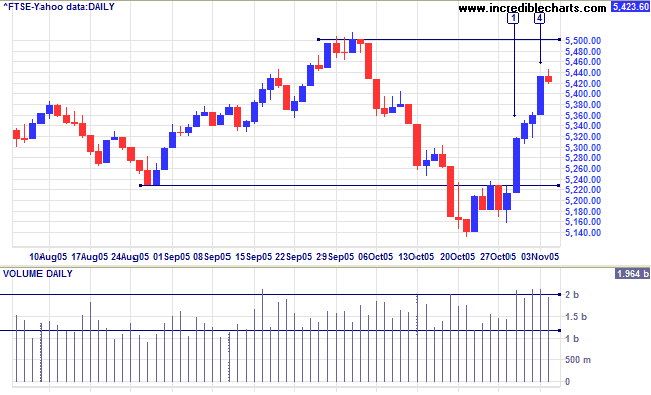
The FTSE 100 broke through resistance at 5228 before commencing a steep climb. Tall blue candles and strong volume at [1] and [4] indicate the extent of buyer commitment. Twiggs Money Flow (21-day) has recovered to above zero. Friday shows a loss of momentum and may precede a short consolidation or retracement, but we are likely to see a test of resistance at 5500 in the short/medium term. A narrow consolidation, or short retracement, below 5500 would be a bullish sign. The target for a breakout would be 5500 + (5500 - 5140) = 5860; close to the 6000 level.
The FTSE 100 broke through resistance at 5228 before commencing a steep climb. Tall blue candles and strong volume at [1] and [4] indicate the extent of buyer commitment. Twiggs Money Flow (21-day) has recovered to above zero. Friday shows a loss of momentum and may precede a short consolidation or retracement, but we are likely to see a test of resistance at 5500 in the short/medium term. A narrow consolidation, or short retracement, below 5500 would be a bullish sign. The target for a breakout would be 5500 + (5500 - 5140) = 5860; close to the 6000 level.
Japan
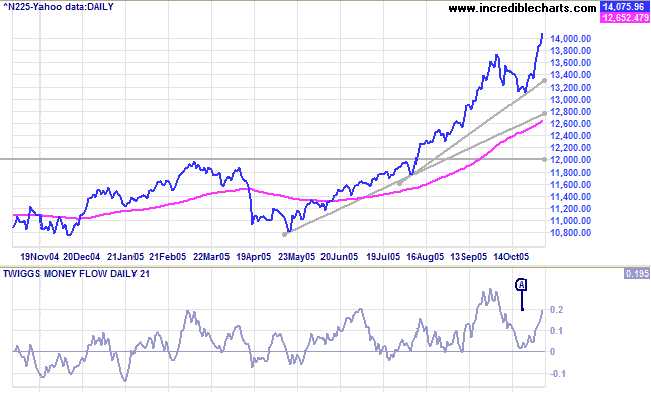
The Nikkei 225 has again shown itself to be the strongest of the markets under review. The short correction left a large space above the 12000 support level and Twiggs Money Flow (21-day) signals strong accumulation with a trough above the zero line. The index's sharp climb above the October high indicates a significant imbalance between buyers and sellers: the primary up-trend should continue for some time. The long-term target is 12000 + ( 12000 - 7600 [April 2003]) = 16400.
The Nikkei 225 has again shown itself to be the strongest of the markets under review. The short correction left a large space above the 12000 support level and Twiggs Money Flow (21-day) signals strong accumulation with a trough above the zero line. The index's sharp climb above the October high indicates a significant imbalance between buyers and sellers: the primary up-trend should continue for some time. The long-term target is 12000 + ( 12000 - 7600 [April 2003]) = 16400.
ASX Australia
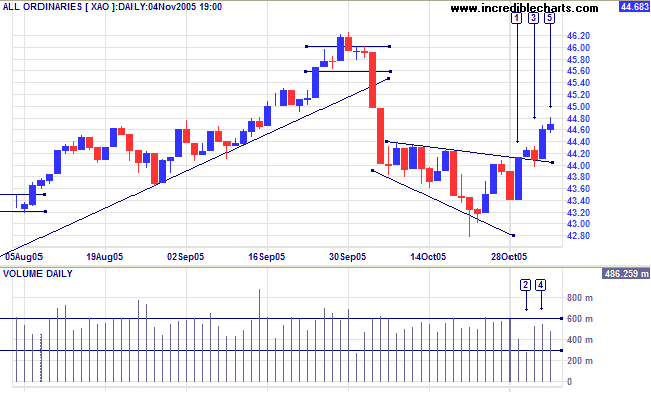
The All Ordinaries completed a descending broadening wedge pattern on Tuesday, after a partial decline at [1]. This is a continuation pattern and the index should at least test the previous high of 4620.
The narrow range and low volume at [2] is attributable to the Melbourne Cup. The short reaction at [3] is a bullish sign, but a further pull-back may follow. Fort per cent of breakouts are followed by a pull-back to the upper border of the pattern according to Thomas Bulkowski (Encyclopedia of Chart Patterns).
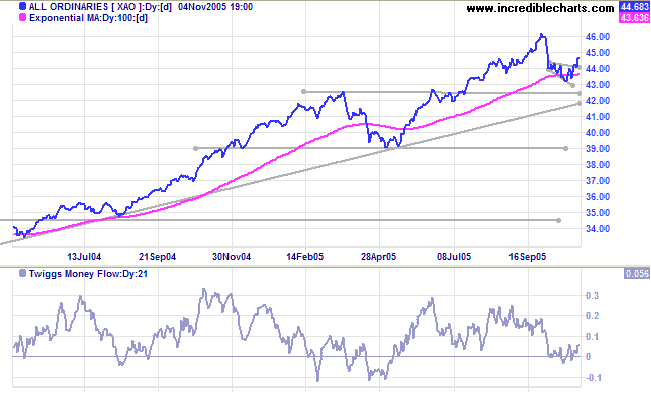
Twiggs Money Flow (21-day) remains close to the zero line;
not yet displaying any significant accumulation signal.
The index is in a strong primary up-trend, with initial resistance at 4620. A breakout would present a target close to 5000: 4620 + (4620 - 4300) = 4940. Though unlikely at this stage, a break below the upper border of the broadening wedge pattern would signal a re-test of support at 4250.
The index is in a strong primary up-trend, with initial resistance at 4620. A breakout would present a target close to 5000: 4620 + (4620 - 4300) = 4940. Though unlikely at this stage, a break below the upper border of the broadening wedge pattern would signal a re-test of support at 4250.
For further assistance, read About
the Trading Diary.
Colin Twiggs
Let others lead small lives, but not you.
Let others argue over small things, but not you.
Let others cry over small hurts, but not you.
Let others leave their future in someone else's hands, but not you.
~ Jim Rohn
Let others argue over small things, but not you.
Let others cry over small hurts, but not you.
Let others leave their future in someone else's hands, but not you.
~ Jim Rohn
Back Issues
Access the Trading Diary Archives.

Author: Colin Twiggs is a former investment banker with almost 40 years of experience in financial markets. He co-founded Incredible Charts and writes the popular Trading Diary and Patient Investor newsletters.
Using a top-down approach, Colin identifies key macro trends in the global economy before evaluating selected opportunities using a combination of fundamental and technical analysis.
Focusing on interest rates and financial market liquidity as primary drivers of the economic cycle, he warned of the 2008/2009 and 2020 bear markets well ahead of actual events.
He founded PVT Capital (AFSL No. 546090) in May 2023, which offers investment strategy and advice to wholesale clients.