Trading Diary
October 22, 2005
These extracts from my daily trading diary are
for educational purposes and should not be interpreted as
investment advice. Full terms and conditions can be found at
Terms
of Use.
USA
The S&P 500 is consolidating in a narrow range below the new 1200 resistance level. Strong volume on days [3] and [4] reveals the presence of both buying support and committed sellers; neither has so far gained control. A close above 1200 would signal the end of the secondary correction, but the more likely scenario is a close below support at 1170 followed by a test of primary support at 1140.
The S&P 500 is consolidating in a narrow range below the new 1200 resistance level. Strong volume on days [3] and [4] reveals the presence of both buying support and committed sellers; neither has so far gained control. A close above 1200 would signal the end of the secondary correction, but the more likely scenario is a close below support at 1170 followed by a test of primary support at 1140.
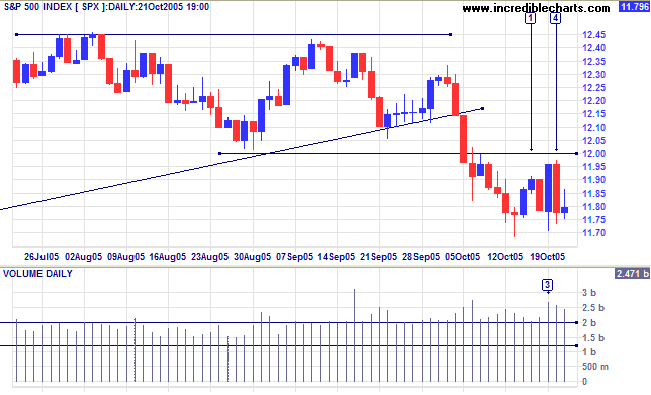
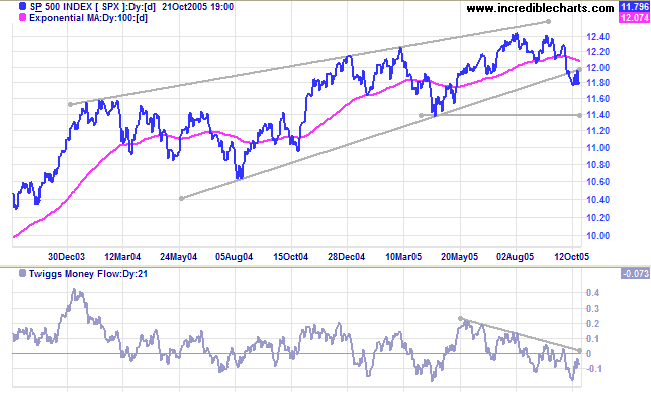
The bearish
rising wedge pattern is confirmed by the pull-back that
respected resistance at the lower border of the wedge pattern.
The target is 1000: 1200 - (1240 - 1060) = 1020. This would be
confirmed if primary support at 1140 was broken.
Twiggs Money Flow (21-day) signals
distribution; a peak below the zero line would strengthen the
signal.
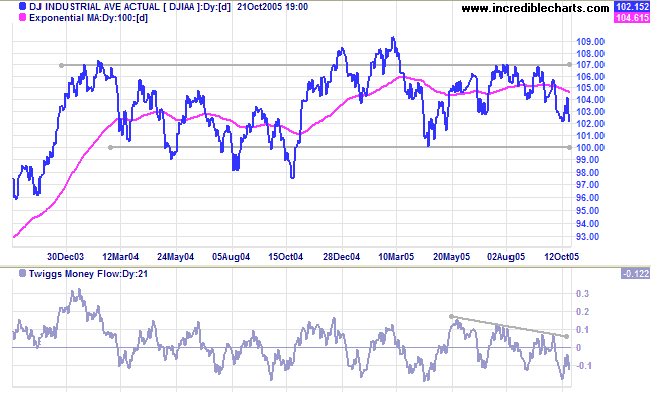
The Dow Industrial Average is headed for a test of primary
support at 10000.
Twiggs Money Flow (21-day) signals strong distribution.
The most likely scenario is for the Dow to range between 10000 and 11000 for some time -- restraining advances on the S&P 500 and NASDAQ indices -- while a fall below 10000 would signal the start of a primary down-trend.
The most likely scenario is for the Dow to range between 10000 and 11000 for some time -- restraining advances on the S&P 500 and NASDAQ indices -- while a fall below 10000 would signal the start of a primary down-trend.
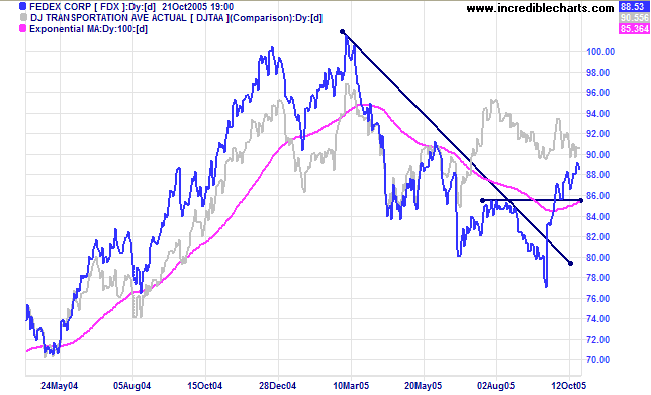
Fedex has reversed to a primary up-trend; a bullish sign for the
Dow Jones Transportation Average.
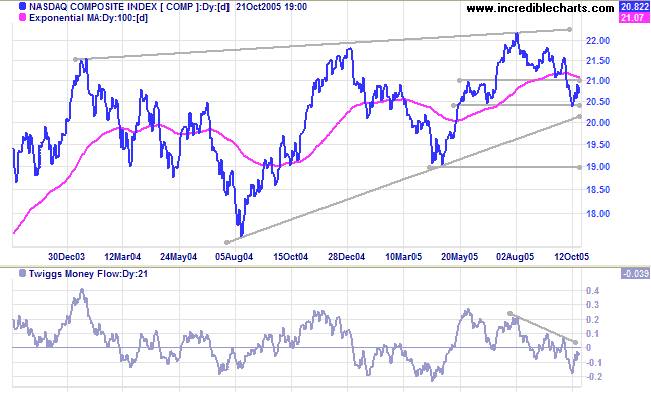
The Nasdaq Composite respected the new resistance level at
2100 and is likely to test the lower border of the bearish
rising wedge pattern.
Twiggs Money Flow (21-day) signals distribution.
A close below lower border of the rising wedge pattern would be a strong bear signal, while a fall below 1900 would signal the start of a primary down-trend.
A close below lower border of the rising wedge pattern would be a strong bear signal, while a fall below 1900 would signal the start of a primary down-trend.
Treasury yields
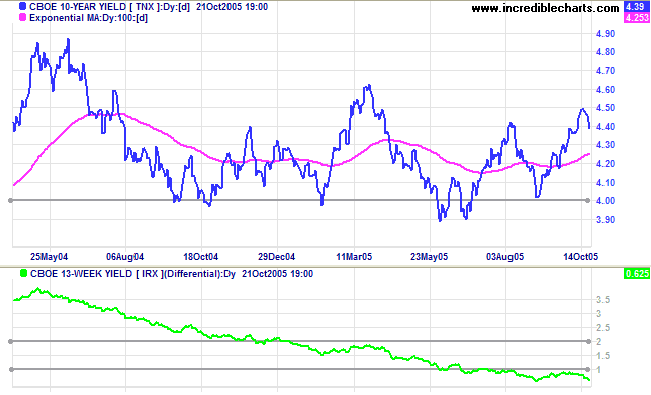
Richmond Fed President Jeffrey Lacker poured cold water over hopes of an easing in interest rate hikes: "The proper lesson from the 1970s is not that energy price shocks induce major recessions; it is that monetary policy that reacts to energy price shocks by accommodating the rise in inflation, and subsequently has to fight inflation, can induce major recession."
Long-bond yields eased to 4.4%, while short-term yields continue to climb. The further fall in the yield differential (10-year T-notes minus 13-week T-bills) is a long-term bear signal for equity markets.
Gold
New York: Spot gold is consolidating in a narrow band above support at $460, closing at $467.10 on Friday. This is normally a continuation pattern and price appears headed for a test of resistance at $500; confirmed if the metal rises to a new October high.
New York: Spot gold is consolidating in a narrow band above support at $460, closing at $467.10 on Friday. This is normally a continuation pattern and price appears headed for a test of resistance at $500; confirmed if the metal rises to a new October high.
United Kingdom
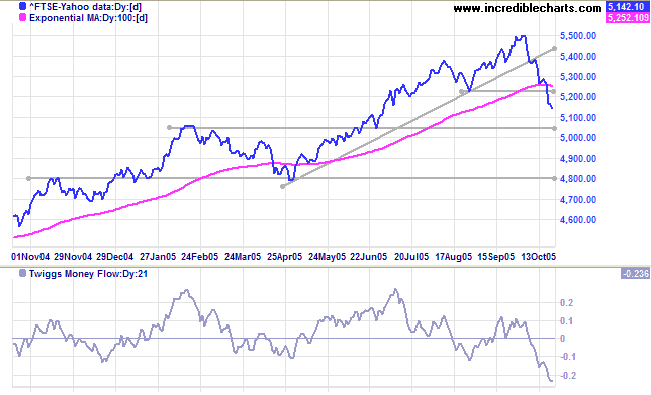
The FTSE 100 fell sharply through support at 5225 signaling the start of a strong secondary correction (not a primary trend reversal as mentioned last week: the previous down-swing was too short). Twiggs Money Flow (21-day) signals strong distribution; expect a test of primary support at 4800, with initial support at 5050 likely to fail.
The FTSE 100 fell sharply through support at 5225 signaling the start of a strong secondary correction (not a primary trend reversal as mentioned last week: the previous down-swing was too short). Twiggs Money Flow (21-day) signals strong distribution; expect a test of primary support at 4800, with initial support at 5050 likely to fail.
Japan
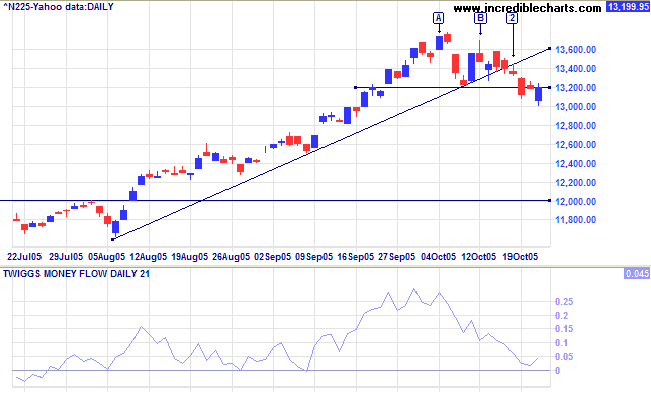
The Nikkei 225 broke the rising trendline at [2], signaling a loss of momentum. The subsequent fall below support at 13200 signals the start of a secondary correction. Twiggs Money Flow (21-day) above zero is a positive sign, signaling long-term accumulation. The primary up-trend continues.
The long-term target for the breakout is 16400: 12000 + ( 12000 - 7600 [the April 2003 low]).
ASX Australia
The All Ordinaries has formed a descending broadening wedge over the last two weeks: a rare pattern that normally resolves in the direction of the long-term trend (in this case up). Friday's long tail signals buying support above the first major support line (from the previous peak in the primary up-trend) at 4250/60. Attempts to enter at this point are inadvisable because of the high failure rate. Thomas Bulkowski (Encyclopedia of Chart Patterns) recommends waiting for a close above the upper trendline or a partial decline: a trough that is higher than the preceding trough.
The All Ordinaries has formed a descending broadening wedge over the last two weeks: a rare pattern that normally resolves in the direction of the long-term trend (in this case up). Friday's long tail signals buying support above the first major support line (from the previous peak in the primary up-trend) at 4250/60. Attempts to enter at this point are inadvisable because of the high failure rate. Thomas Bulkowski (Encyclopedia of Chart Patterns) recommends waiting for a close above the upper trendline or a partial decline: a trough that is higher than the preceding trough.
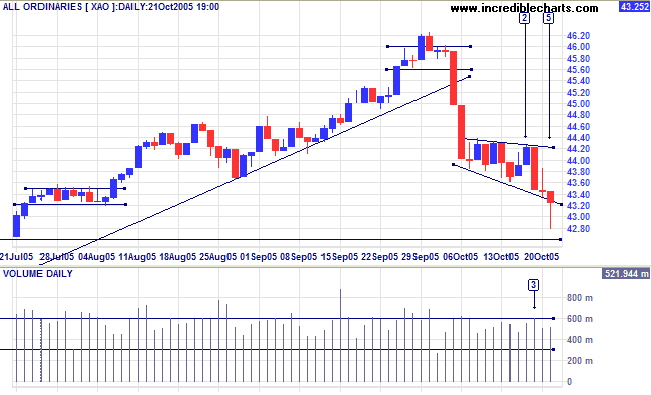
Twiggs Money Flow (21-day) has fallen below zero, signaling
short- to medium-term distribution. If the index respects initial
support at 4250/60, that would be a bullish sign indicating that
the up-trend has sufficient strength to test 5000: 4600 + (4600 -
4250) = 4950. This is in the same ballpark as the
aggressive target calculated by projecting the previous up-swing
from its' peak: 4250 + (4250 - 3450) = 5050.
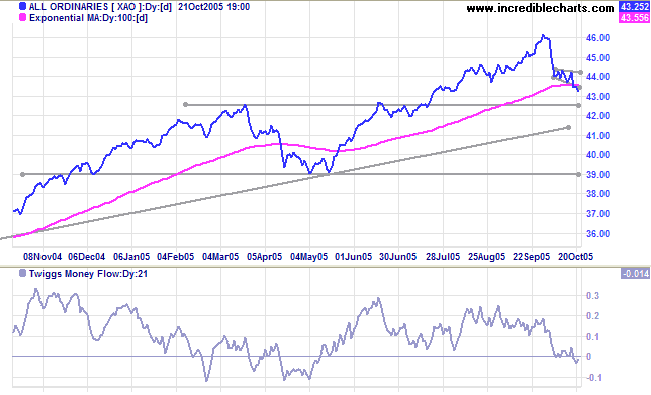
Failure of support at 4250, on the other hand, would mean a test of primary support at 3900. The primary trend would reverse in the at present unlikely event that 3900 fails. However, a primary trend reversal on the Dow or S&P 500 would have a domino effect on the Australian market, placing severe pressure on primary support levels.
Failure of support at 4250, on the other hand, would mean a test of primary support at 3900. The primary trend would reverse in the at present unlikely event that 3900 fails. However, a primary trend reversal on the Dow or S&P 500 would have a domino effect on the Australian market, placing severe pressure on primary support levels.
For further assistance, read About
the Trading Diary.
Colin Twiggs
|
Never confuse yourself by visions of an
entire lifetime at once. That is, do not let your thoughts
range over the whole multitude and variety of the
misfortunes that may befall you, but rather, as you
encounter each one, ask yourself, "What is there
unendurable, so insupportable, in this?" You will find that
you are ashamed to admit defeat. Again, remember that it is
not the weight of the future or the past that is pressing
upon you, but ever that of the present alone. Even this
burden, too, can be lessened if you confine it strictly to
its own limits, and are severe enough with your mind's
inability to bear such a trifle. |
| ~ Marcus Aurelius |
Back Issues
Access the Trading Diary Archives.

Author: Colin Twiggs is a former investment banker with almost 40 years of experience in financial markets. He co-founded Incredible Charts and writes the popular Trading Diary and Patient Investor newsletters.
Using a top-down approach, Colin identifies key macro trends in the global economy before evaluating selected opportunities using a combination of fundamental and technical analysis.
Focusing on interest rates and financial market liquidity as primary drivers of the economic cycle, he warned of the 2008/2009 and 2020 bear markets well ahead of actual events.
He founded PVT Capital (AFSL No. 546090) in May 2023, which offers investment strategy and advice to wholesale clients.