Trading Diary
October 15, 2005
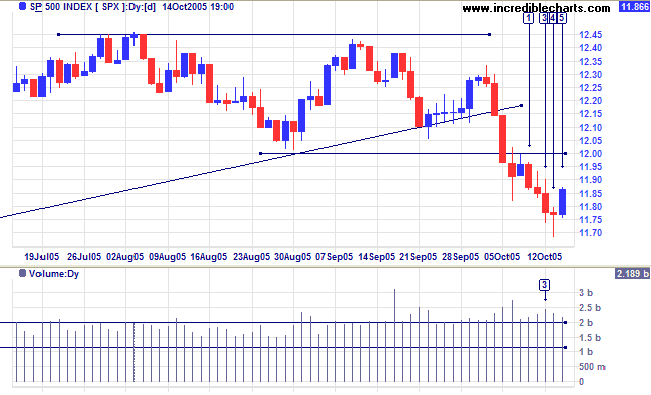
The S&P 500 has commenced a pull-back at [5], to test the new 1200 resistance level, after weak closes and strong volume at [3] and [4] signaled buying support around 1175.
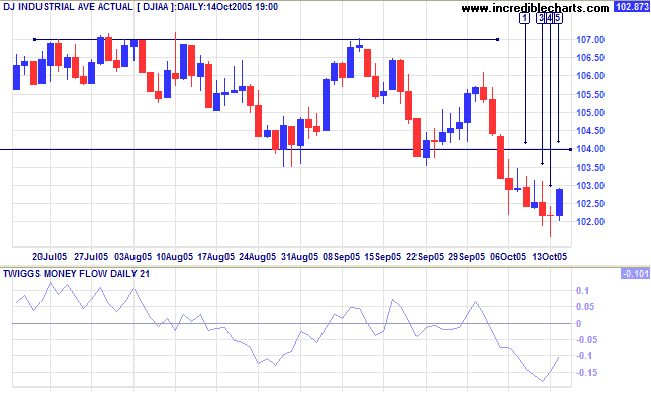
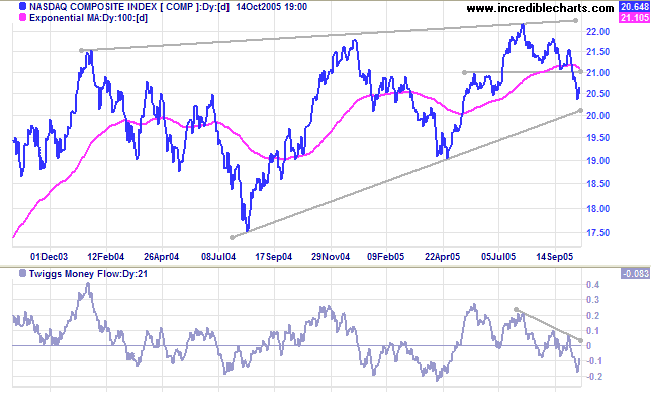
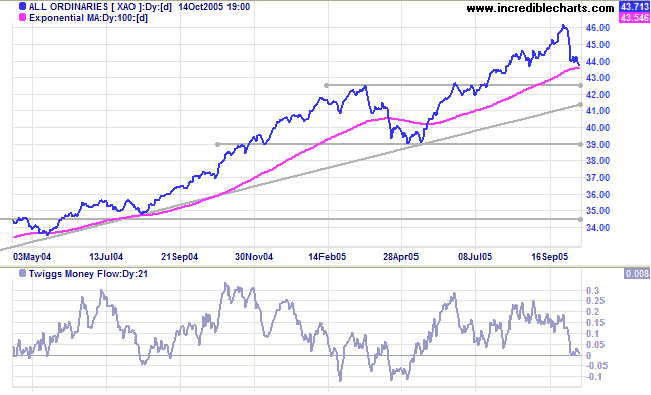
In the long-term expect consolidation between 10000 and 11000.
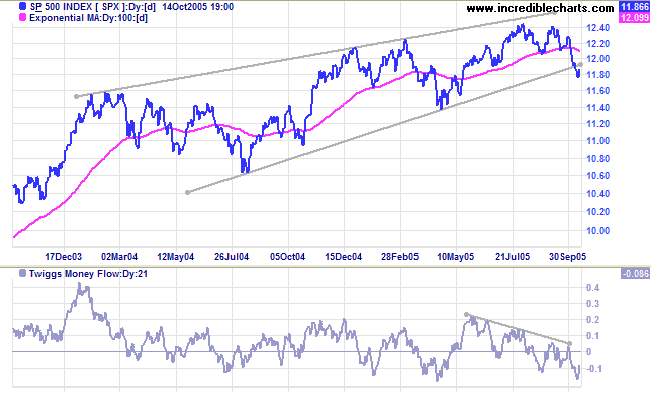
The primary trend is in a top pattern, with a flat 100-day MA.
A breach of primary support at 1900 would signal the start of a primary down-trend.
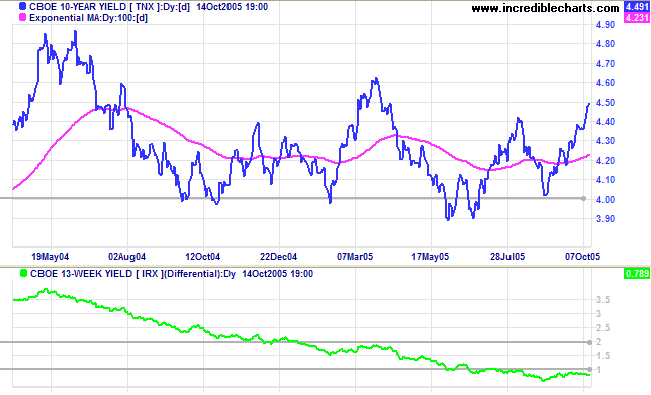
Both long and short-term yields climbed sharply, after the recent Fed policy meeting indicated further rate hikes are necessary to contain inflation. The yield differential (10-year T-notes minus 13-week T-bills) remains below 1%, squeezing bank margins. A flat yield curve is detrimental to the profitability of banks (who pay mostly short-term rates to depositors while charging long-term rates to borrowers) and a long-term bear signal for the entire equity market.
New York: Spot gold is wedging slowly upwards, having closed at $469.20 on Friday. The pattern is a form of consolidation; likely to end with resumption of the primary up-trend. A fall below support at 460, on the other hand, would indicate the start of a secondary correction.
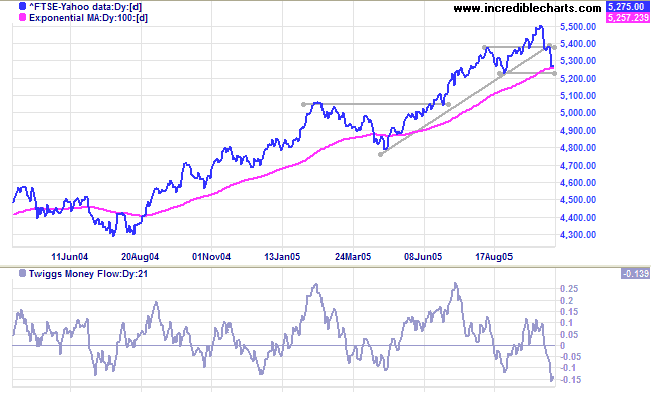
Having broken the ascending trendline, the FTSE 100 is headed for a test of primary support at 5225. Failure of this level would signal reversal to a down-trend. Twiggs Money Flow (21-day) supports this, with a sharp fall below zero signaling strong distribution.
However, the outcome of most equal lows in an up-trend is in the direction of the prevailing trend. If the index respects support at 5225, the result is likely to test resistance at 5500.
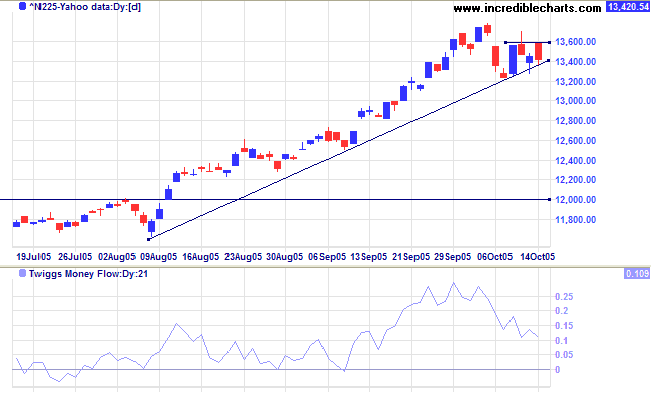
The Nikkei 225 remains in an up-trend, but declining Twiggs Money Flow (21-day) signals short-term distribution. Resistance at 13600, below the previous peak, is also a bearish sign. A fall below last Friday's low of 13200 would signal the start of a secondary correction; possibly testing support at 12000.
The primary up-trend appears strong and support at 12000 is likely to hold. The long-term target for the breakout is: 12000 + ( 12000 - 7600 [the April 2003 low]) = 16400.
The All Ordinaries consolidated in a narrow range for most of the week before a false break at [4]; the long tail and increased volume indicating buying support. The Friday breakout appears tentative, with reasonable volume but a fairly weak close [5]. The target for the breakout is: 4380 - (4580 - 4380) = 4180. However, beware of a close back above 4380 which would indicate a bear trap.
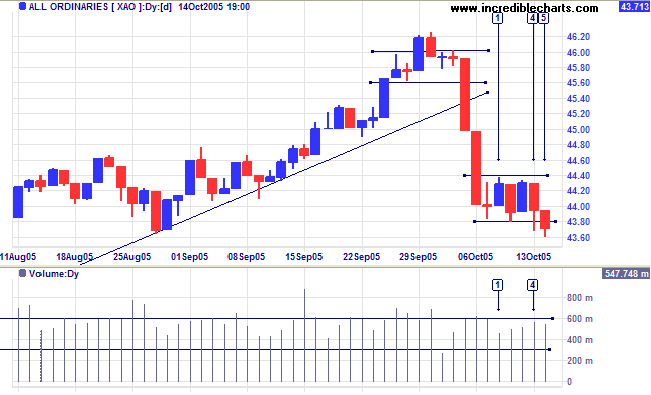
Failure of initial support, however, would indicate that the primary trend is weakening and a test of primary support at 3900 likely. Continued weakness on the Dow and S&P 500 would have a bearish influence on the All Ords.
but is not able to cash in on the experience.
~ Elbert Hubbard
Back Issues

Author: Colin Twiggs is a former investment banker with almost 40 years of experience in financial markets. He co-founded Incredible Charts and writes the popular Trading Diary and Patient Investor newsletters.
Using a top-down approach, Colin identifies key macro trends in the global economy before evaluating selected opportunities using a combination of fundamental and technical analysis.
Focusing on interest rates and financial market liquidity as primary drivers of the economic cycle, he warned of the 2008/2009 and 2020 bear markets well ahead of actual events.
He founded PVT Capital (AFSL No. 546090) in May 2023, which offers investment strategy and advice to wholesale clients.