Trading Diary
October 8, 2005
These extracts from my daily trading diary are
for educational purposes and should not be interpreted as
investment advice. Full terms and conditions can be found at
Terms
of Use.
USA
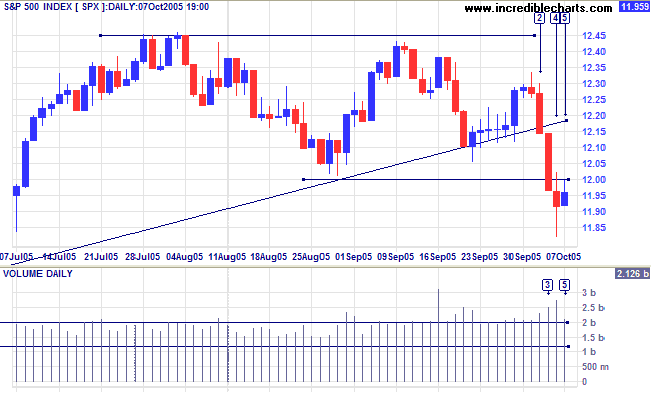
The S&P 500 gave early signs of a reversal at [2], with a trendline break signaling faltering momentum. Wednesday confirmed the reversal with a close below primary support at 1200 on strong volume [3]. The target for the completed double top is: 1200 - (1245 - 1200) = 1155. Thursday [4] displays buying support, with a long tail and strong volume, while Friday [5] shows a weak test of the new resistance level at 1200. A narrow consolidation or a fall below the low of [4] would be bearish signs, but a close back above 1200 would signal a bear trap.
The S&P 500 gave early signs of a reversal at [2], with a trendline break signaling faltering momentum. Wednesday confirmed the reversal with a close below primary support at 1200 on strong volume [3]. The target for the completed double top is: 1200 - (1245 - 1200) = 1155. Thursday [4] displays buying support, with a long tail and strong volume, while Friday [5] shows a weak test of the new resistance level at 1200. A narrow consolidation or a fall below the low of [4] would be bearish signs, but a close back above 1200 would signal a bear trap.
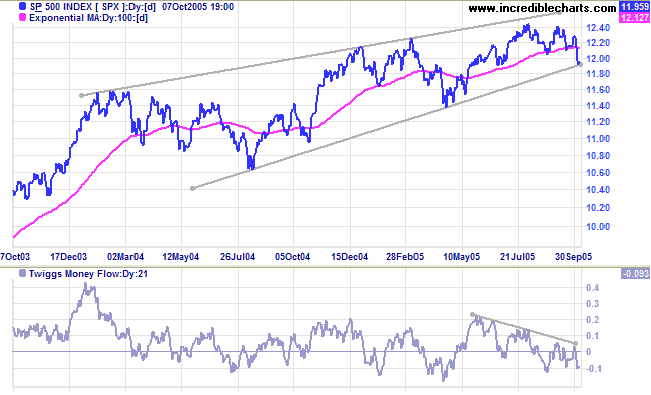
The index is testing the lower border of the long-term
rising wedge pattern. A close below the border would warn of
a primary trend reversal; and a close below 1140 would confirm.
Twiggs Money Flow (21-day) is below zero, signaling
distribution.
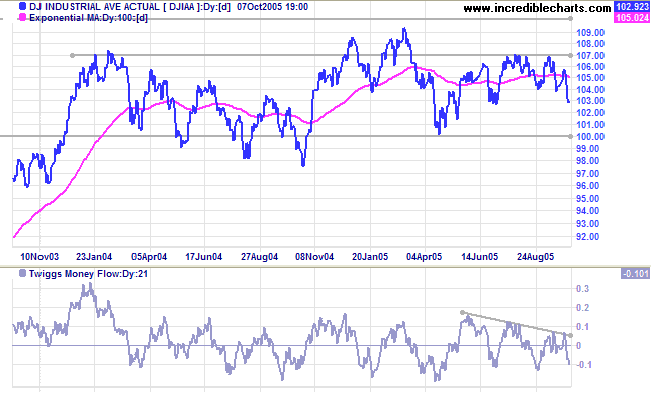
The Dow Industrial Average closed below 10400 and appears
headed for a test of primary support at 10000.
Twiggs Money Flow (21-day) reversed below zero, to signal
distribution. A fall below 10000 would signal a primary trend
reversal, but the most likely scenario is for the index to
continue ranging between 10000 and 11000.
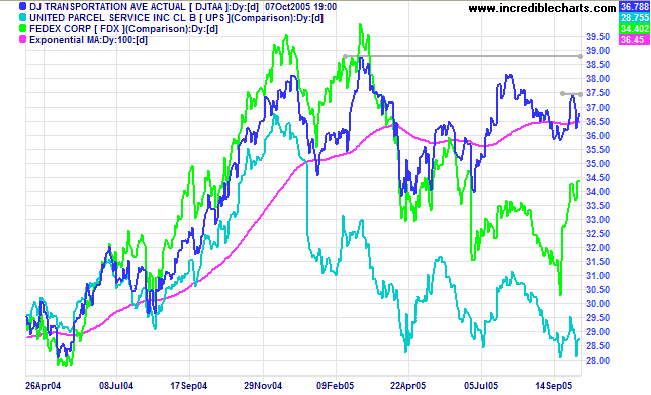
A rise of the Dow Jones Transportation Average above 3750
would confirm that the primary up-trend has resumed; led by the
recent Fedex reversal to a primary up-trend. UPS remains
uncertain. An index rise above the March 2005 high would end the
top pattern.
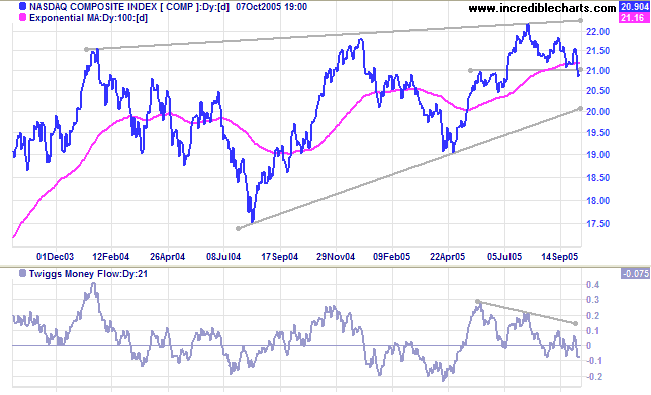
The Nasdaq Composite closed below 2100, signaling a test
of the lower border of the long-term bearish
rising wedge pattern.
Twiggs Money Flow (21-day) retreated below zero to signal
distribution.
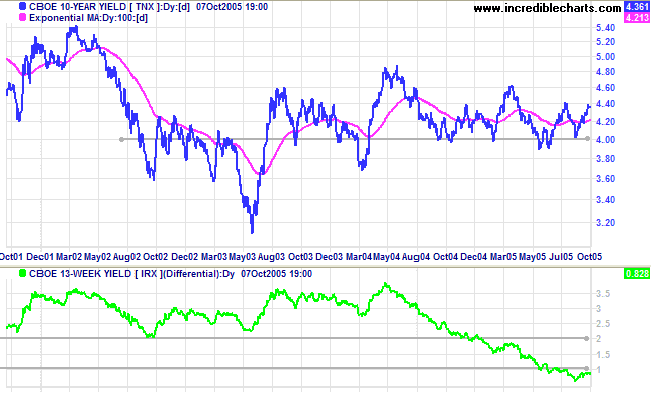
Treasury yields
Long bond yields are climbing towards 4.5% on the back of increased inflation fears. The yield differential (10-year T-notes minus 13-week T-bills) remains below 1%, indicating a flat yield curve, with negative implications for the economy within the next year.
Long bond yields are climbing towards 4.5% on the back of increased inflation fears. The yield differential (10-year T-notes minus 13-week T-bills) remains below 1%, indicating a flat yield curve, with negative implications for the economy within the next year.
Gold
New York: Spot gold again pulled back, respecting support at $460, before rallying to a new high of $474.00 on Friday. The metal appears headed for an attempt on $500.
New York: Spot gold again pulled back, respecting support at $460, before rallying to a new high of $474.00 on Friday. The metal appears headed for an attempt on $500.
United Kingdom
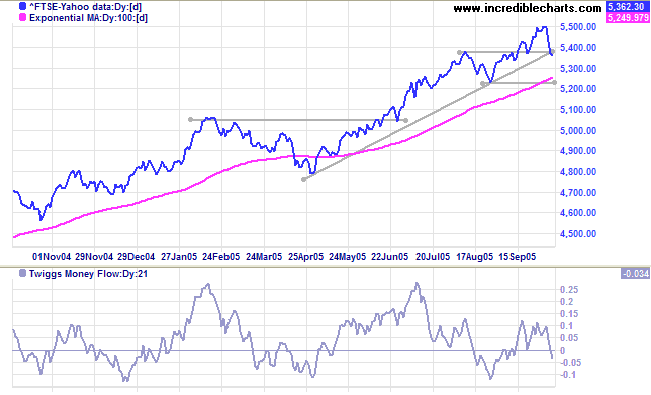
The FTSE 100 is testing support at the top of the earlier cup and handle pattern. Twiggs Money Flow (21-day) retreated below zero, signaling distribution.
A close below the August low (from the cup and handle pattern) would signal reversal of the primary up-trend; while a retracement that respects the (same) primary support level would be a bullish sign.
Japan
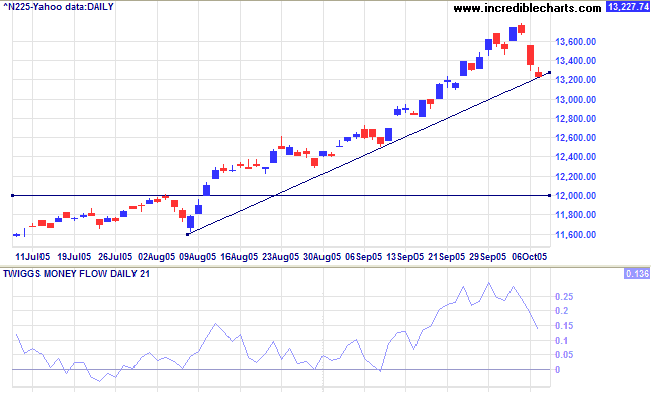
The Nikkei 225 has cut back sharply from its' accelerating trend, following the retracement on US markets. This is likely to develop into a secondary correction: there are no major support levels above 12000 (which is likely to hold against all but the sternest tests).
Twiggs Money Flow (21-day) fell sharply but remains above zero, signaling long-term accumulation. The long-term target from the earlier breakout remains: 12000 + (12000 - 7600 [the April 2003 low]) = 16400.
ASX Australia
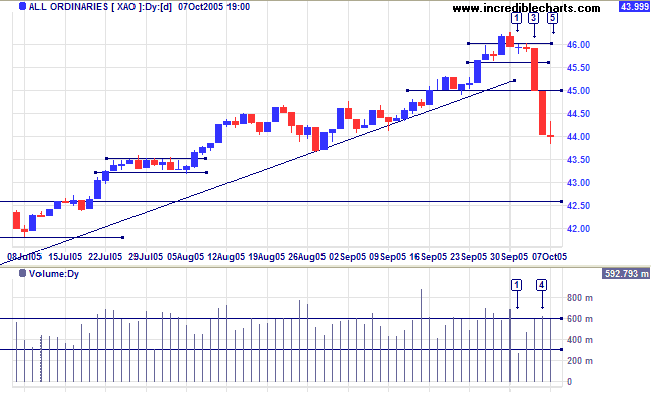
The All Ordinaries consolidated at the start of the week after a NSW holiday on Monday [1]. Wednesday [3] fell through short-term support at 4560 signaling the start of a secondary correction, triggered by weakness in the US and profit-taking at the 4600 (medium-term) target. Another strong red candle followed at [4]; while Friday [5] signals buying support at 4400, with a doji candle and strong volume. We are likely to see a second wave of selling, with a close below the low of [5]. A close above the high, however, would warn that buyers have gained the upper hand and a recovery may be imminent.
The All Ordinaries consolidated at the start of the week after a NSW holiday on Monday [1]. Wednesday [3] fell through short-term support at 4560 signaling the start of a secondary correction, triggered by weakness in the US and profit-taking at the 4600 (medium-term) target. Another strong red candle followed at [4]; while Friday [5] signals buying support at 4400, with a doji candle and strong volume. We are likely to see a second wave of selling, with a close below the low of [5]. A close above the high, however, would warn that buyers have gained the upper hand and a recovery may be imminent.
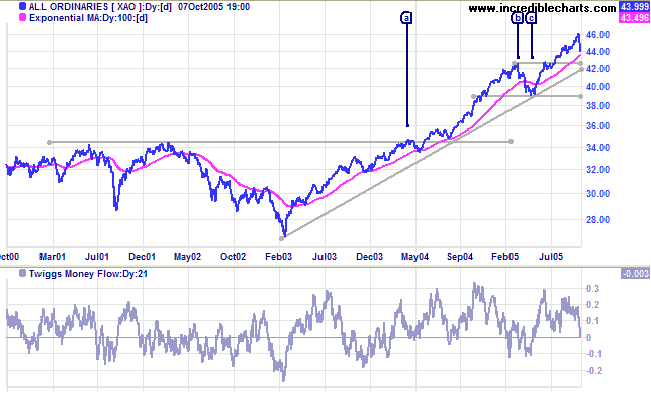
Let's get recent events into perspective: the odds continue to
favor the upside. If the index respects support at 4260, that
would indicate that the primary up-trend remains strong. A
successful test of primary support at 3900 would also suggest
further upside potential; but a close below 3900 would signal
reversal to a primary down-trend.
Twiggs Money Flow (21-day) fell sharply and appears set to cross below zero, signaling short-term distribution.
Keep an eye on the S&P 500. If that reverses to a primary down-trend then all bets are off: the All Ords is likely to follow.
Twiggs Money Flow (21-day) fell sharply and appears set to cross below zero, signaling short-term distribution.
Keep an eye on the S&P 500. If that reverses to a primary down-trend then all bets are off: the All Ords is likely to follow.
For further assistance, read About
the Trading Diary.
Colin Twiggs
When written in Chinese, the word crisis is composed of
two characters
-- one represents danger, and the other represents opportunity.
~ J.F. Kennedy
-- one represents danger, and the other represents opportunity.
~ J.F. Kennedy
Back Issues
Access the Trading Diary Archives.

Author: Colin Twiggs is a former investment banker with almost 40 years of experience in financial markets. He co-founded Incredible Charts and writes the popular Trading Diary and Patient Investor newsletters.
Using a top-down approach, Colin identifies key macro trends in the global economy before evaluating selected opportunities using a combination of fundamental and technical analysis.
Focusing on interest rates and financial market liquidity as primary drivers of the economic cycle, he warned of the 2008/2009 and 2020 bear markets well ahead of actual events.
He founded PVT Capital (AFSL No. 546090) in May 2023, which offers investment strategy and advice to wholesale clients.