Trading Diary
October 1, 2005
These extracts from my daily trading diary are
for educational purposes and should not be interpreted as
investment advice. Full terms and conditions can be found at
Terms
of Use.
USA
The S&P 500 consolidated in a narrow band for most of the week before a strong blue candle on Thursday signaled another rally to test resistance at 1245.
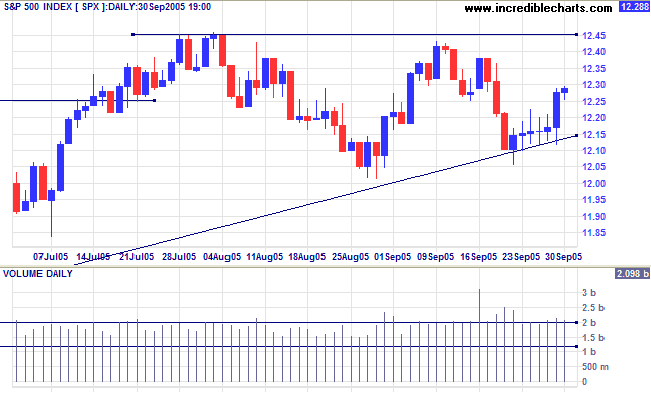
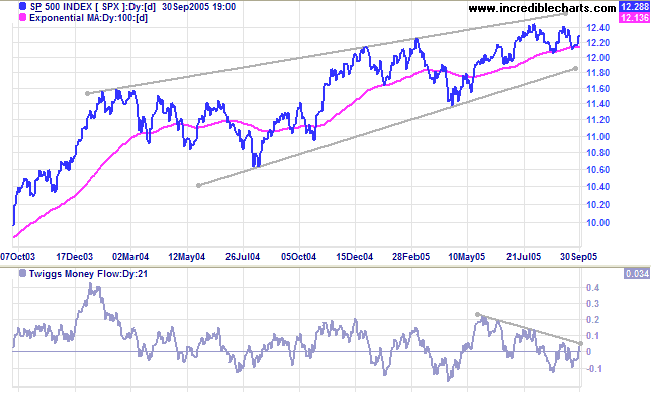
The long-term
rising wedge pattern continues. A shorter-term consolidation,
between 1245 and 1200, appears to be forming within the wedge
pattern; a bullish sign that may result in a test of the upper
border of the larger pattern.
Twiggs Money Flow (21-day) continues to whipsaw around zero,
giving no clear signal.
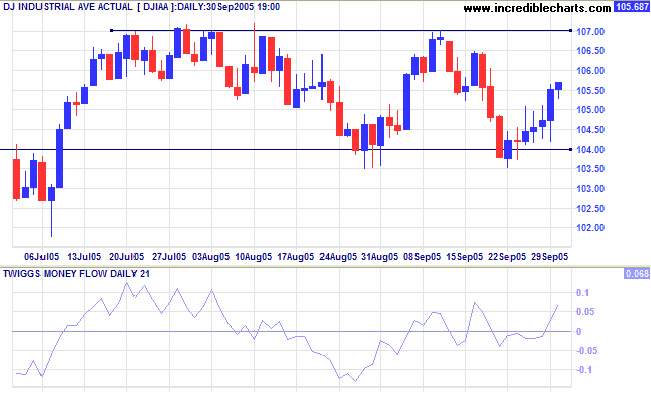
After a shaky start to the week, the Dow Industrial
Average rallied with a strong blue candle on Thursday and
appears headed for another test of resistance at 10700. A close
above 10700 would signal another test of 11000; while a close
below 10400 would signal a test of support at 10000.
Twiggs Money Flow (21-day) has started to strengthen.
In the long term we can expect strong resistance at 11000 and strong support at 10000, with the index ranging between the two levels for some time, restraining advances on other US indices.
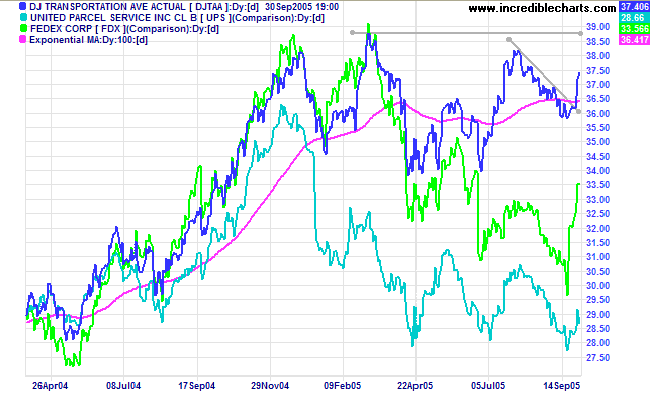
The Dow Jones Transportation Average ended its secondary
correction with a sharp rally, following a steep recovery on
Fedex and UPS that bodes well for more than just the transport
sector. A rise above the March high would end the top pattern.
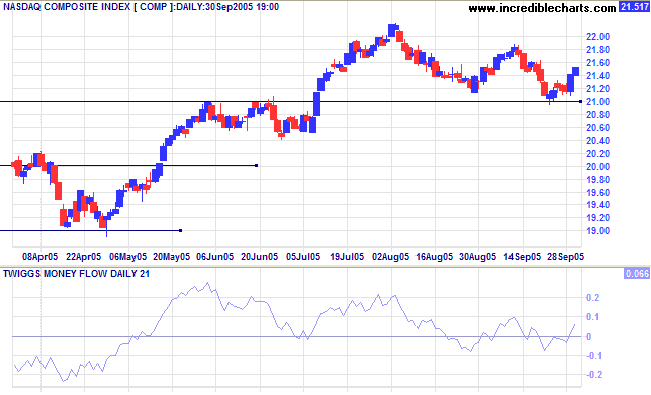
The Nasdaq Composite respected support at 2100 and appears
headed for a test of resistance at 2200. Though less likely, a
close below 2100 would signal a test of the lower border of the
long-term bearish
rising wedge pattern.
Twiggs Money Flow (21-day) continues to whipsaw around zero,
giving no clear signal.
Treasury yields
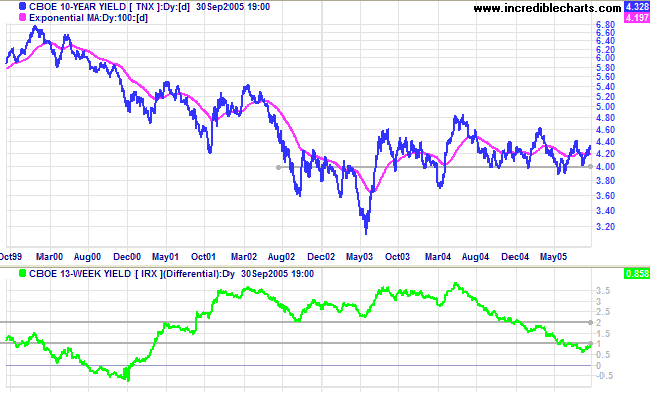
Long yields continue to climb above 4.0%, while short (13-week) yields consolidate below 3.5%. The yield differential (10-year T-notes minus 13-week T-bills) has recovered somewhat but remains below 1%, indicating a flat yield curve, with negative long-term implications for the economy.
We may be witnessing the start of a "managed" rise in long yields. How smooth the process is will depend on the level of co-operation between the Fed and Asian central banks who are major holders of treasuries.
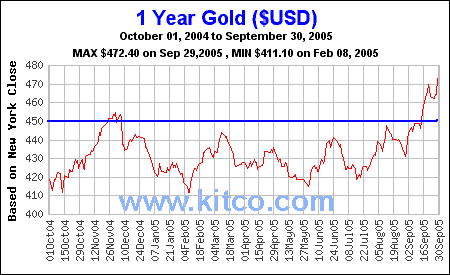
Gold
New York: After a short (bullish) pull-back, spot gold rallied to $468.70 on Friday. The metal appears headed for an attempt on $500.
United Kingdom
The FTSE 100 is testing resistance at 5500, the target of the cup and handle from two weeks ago. Twiggs Money Flow (21-day) continues to signal accumulation.
The primary trend is upward. Expect resistance at 6000 and 6900.
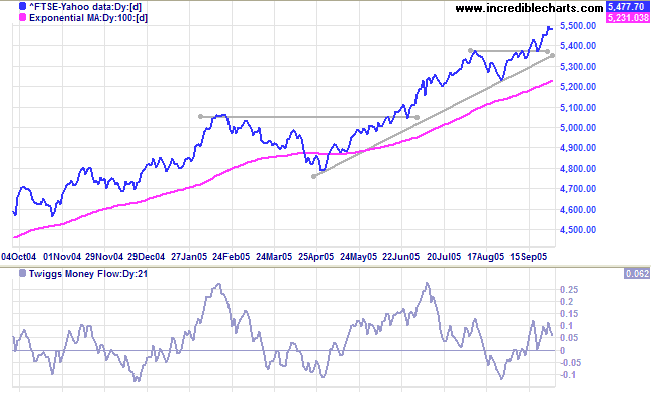
The FTSE 100 is testing resistance at 5500, the target of the cup and handle from two weeks ago. Twiggs Money Flow (21-day) continues to signal accumulation.
The primary trend is upward. Expect resistance at 6000 and 6900.
Japan
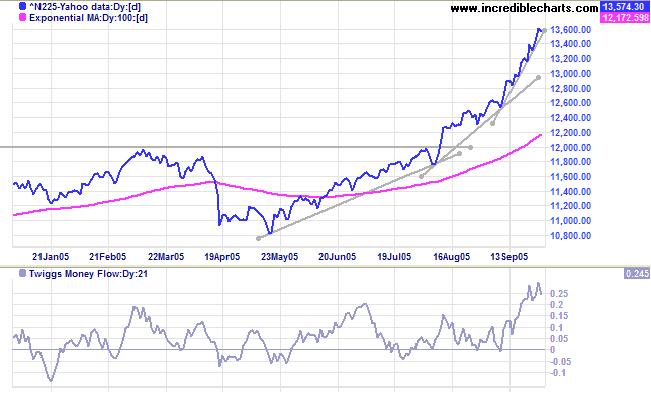
The Nikkei 225 continues its bull market rally with strong volume and very short retracements. The steepening curve warns that the market may be headed for a blow-off: an upward spike followed by a sharp correction.
Twiggs Money Flow (21-day) rose to new highs, signaling rapid accumulation. The long-term target for the breakout remains: 12000 + (12000 - 7600 [the April 2003 low]) = 16400.
ASX Australia
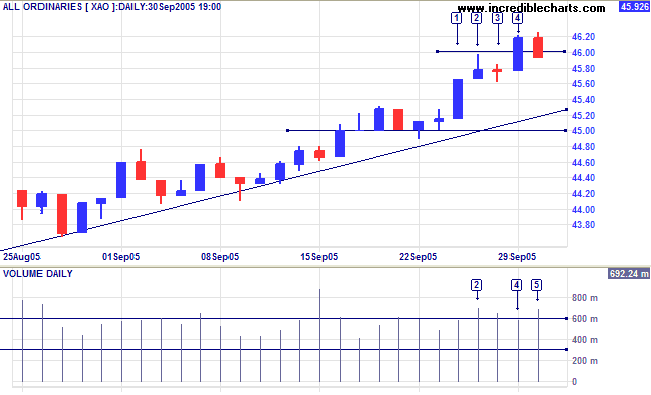
The All Ordinaries broke out from last week's consolidation with a strong blue candle on Monday [1]. Profit-taking at the 4600 target was evident on Tuesday [2] and Wednesday [3] with higher volume and weak closes. A bullish sign followed when sellers were overcome without further retracement and Thursday displayed another strong blue candle [4]. Friday, however, signals further profit taking, with a close back below 4600 on strong volume [5]. A close below the low of [3] would warn of a secondary correction.
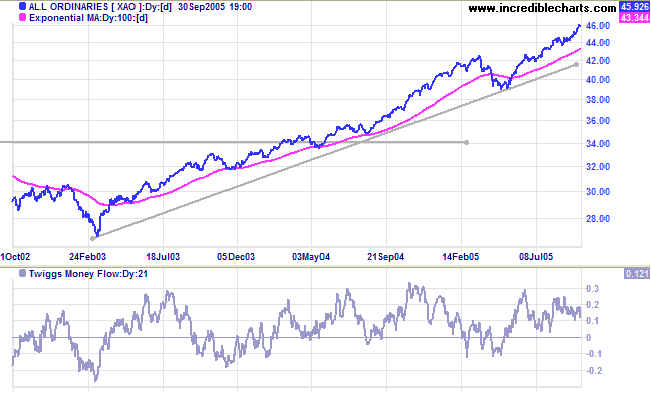
Twiggs Money Flow (21-day) remains high above zero, signaling
strong accumulation. The conventional medium-term target for the
latest rally has been reached. If buyers overcome resistance at
4600, the index may be headed for the more aggressive target of
5000, calculated by projecting the previous up-swing from its'
peak: 4250 [b] + (4250 - 3450 [a]) = 5050.
The All Ords is in a strong primary up-trend, but always keep an eye on the S&P 500.
For further assistance, read About
the Trading Diary.
Colin Twiggs
For every complex problem, there is a solution that is simple,
neat, and wrong.
~ Henry Louis Mencken
Back Issues
Access the Trading Diary Archives.