Trading Diary
September 24, 2005
These extracts from my daily trading diary are
for educational purposes and should not be interpreted as
investment advice. Full terms and conditions can be found at
Terms
of Use.
USA
The S&P 500 entered an intermediate down-swing with three strong red candles taking out the previous short-term low. Strong volumes and a long tail on Thursday indicate that the index found support around 1210. Friday, however, failed to follow through with further gains; and a fall below Thursday's low would mean a test of the important 1200 support level.
The S&P 500 entered an intermediate down-swing with three strong red candles taking out the previous short-term low. Strong volumes and a long tail on Thursday indicate that the index found support around 1210. Friday, however, failed to follow through with further gains; and a fall below Thursday's low would mean a test of the important 1200 support level.
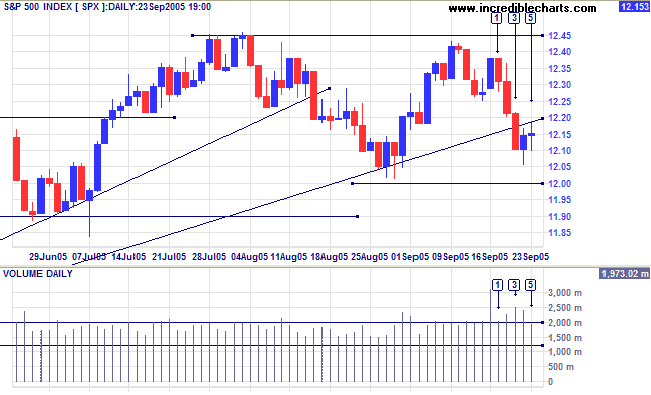
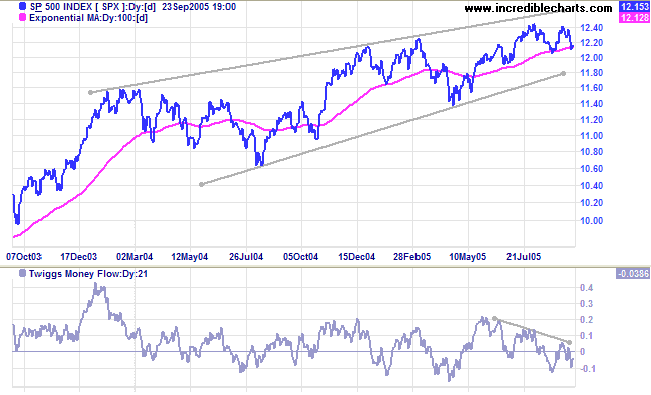
There is no sign yet of a breakout from the long-term
rising wedge pattern. The shorter-term cup and handle pattern
did not complete and the lower peak (September 2005) warns of a
test of the lower border of the wedge pattern.
Twiggs Money Flow (21-day) retreated below zero and now looks
distinctly bearish.
A close below 1200 would normally signal reversal of the primary trend. However, because the index is within a consolidation pattern, we should wait for a breakout to confirm the trend change.
A close below 1200 would normally signal reversal of the primary trend. However, because the index is within a consolidation pattern, we should wait for a breakout to confirm the trend change.
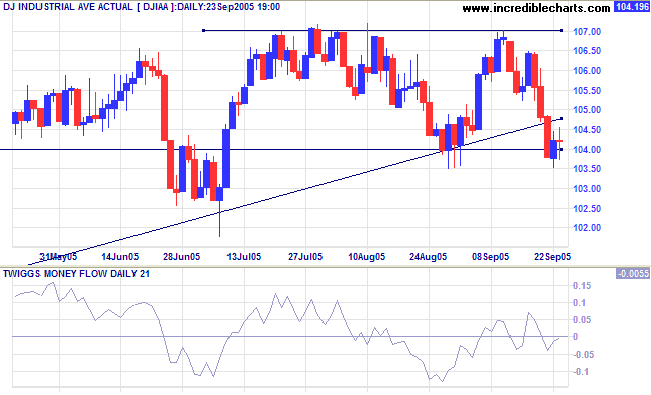
The Dow Industrial Average tested support at 10400 after
reversing, Monday, with a strong red candle. a close below
Thursday's low would signal a test of support at 10000.
Twiggs Money Flow (21-day) is whipsawing around zero, with no
clear signal.
Expect strong resistance at 11000 and strong support at 10000. The most likely scenario is for the Dow to range between 10000 and 11000 for some time; restraining advances on other major US indices.
Expect strong resistance at 11000 and strong support at 10000. The most likely scenario is for the Dow to range between 10000 and 11000 for some time; restraining advances on other major US indices.
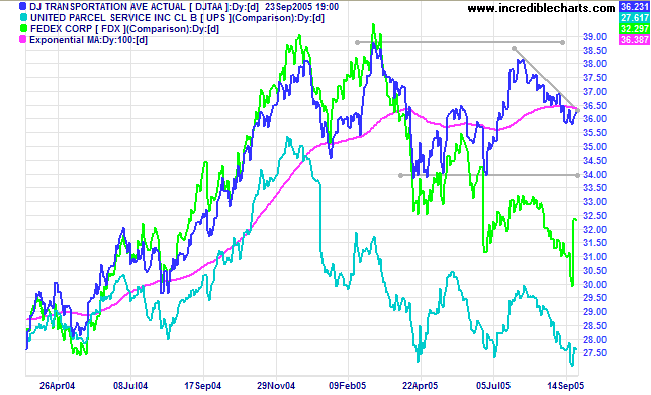
The Dow Jones Transportation Average top continues, with a
secondary correction commencing below the previous high of 3900
and a flat 100-day MA. Fedex and UPS have retreated back above
their support levels on the strength of a drop in oil prices.
This could easily turn into a bear trap if the next retracement
respects the same support level.
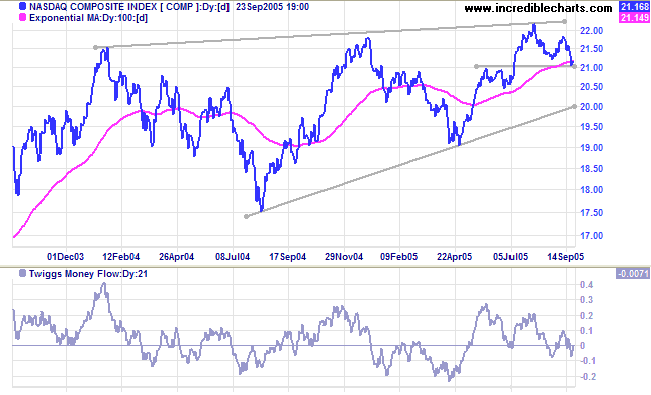
The Nasdaq Composite is testing support at 2100. A close
below this level would signal a test of the lower border of the
bearish
rising wedge pattern.
Twiggs Money Flow (21-day) is whipsawing around zero, giving
no clear signal.
A fall below 2100 would normally indicate a reversal of the primary trend, but we need to wait for a breakout from the wedge pattern for confirmation.
A fall below 2100 would normally indicate a reversal of the primary trend, but we need to wait for a breakout from the wedge pattern for confirmation.
Treasury yields
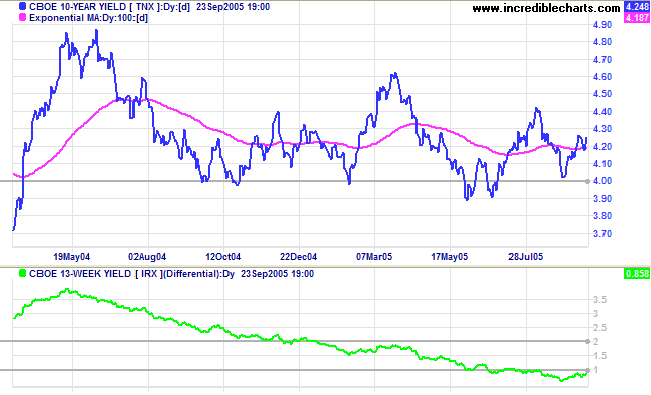
Long-bond yields remain in a broad consolidation above 4.0%. The yield differential (10-year T-notes minus 13-week T-bills) below 1%, indicates a flat yield curve, with negative implications for the economy. A flat yield curve squeezes bank margins and is a bearish long-term signal for equity markets.
The Fed made its 11th consecutive quarter percent increase, Tuesday, lifting the overnight lending rate to 3.75%. The ability of the Fed to manage long-term interest rates is diminished by large foreign central bank holdings of treasuries. It is in the interests of these export economies to support the dollar and stimulate the US economy, but if their priorities ever change, long bond yields would increase sharply, bursting the "asset bubble".
Gold
New York: After testing $470, spot gold pulled back to $463.10 on Friday. The pull-back may test support at $450 before the metal makes another attempt at $500.
New York: After testing $470, spot gold pulled back to $463.10 on Friday. The pull-back may test support at $450 before the metal makes another attempt at $500.
United Kingdom
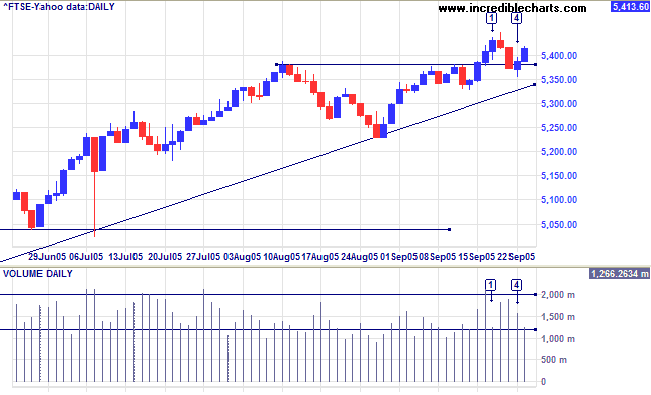
The FTSE 100 pulled back to test the new support level of 5380, after completing a cup and handle last week. The marginal break below the support level is a bullish sign and we are likely to see a rally testing 5500. The target is: 5380 + (5380 - 5230) = 5530.
Twiggs Money Flow (21-day) is above zero, signaling accumulation.
The primary trend is upward. Expect resistance to increase between 6000 and 6900.
Japan
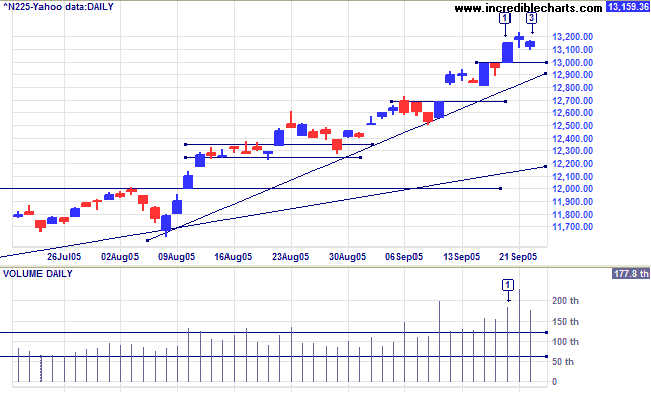
A short week for the Nikkei 225 probably contributed to the high volumes on Tuesday [1] to Thursday [3], but high volumes normally signal a blow-off; and a fall below 13000 would be bearish.
Twiggs Money Flow (21-day) is high above the zero line, signaling strong accumulation. The long-term target for the breakout: 12000 + (12000 - 7600 [the April 2003 low]) = 16400.
ASX Australia
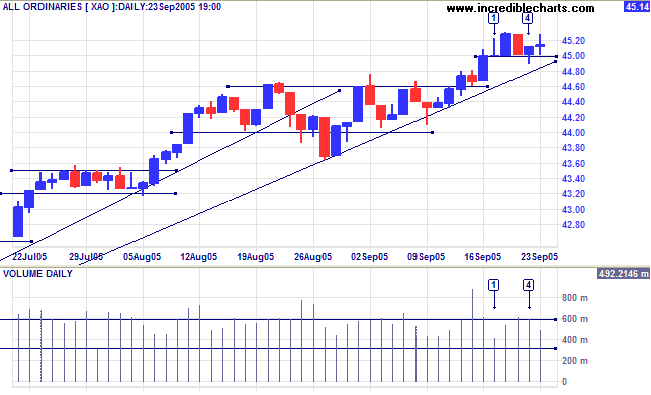
The All Ordinaries consolidated in a narrow range between 4530 and 4500. Buying support is evident at 4500 at [1] and again at [4] where the day closed higher after a long tail and strong volume. A close above 4530 would signal another primary trend move, with a target: 4530 + (4530 - 4460) = 4600. Narrow consolidations are continuation patterns; so a close below 4500 is less likely, but would signal a retracement back to 4400.
The All Ordinaries consolidated in a narrow range between 4530 and 4500. Buying support is evident at 4500 at [1] and again at [4] where the day closed higher after a long tail and strong volume. A close above 4530 would signal another primary trend move, with a target: 4530 + (4530 - 4460) = 4600. Narrow consolidations are continuation patterns; so a close below 4500 is less likely, but would signal a retracement back to 4400.
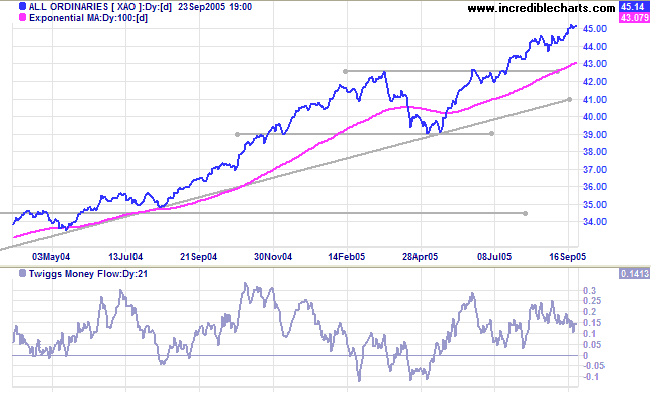
Twiggs Money Flow (21-day) remains high above zero, signaling
strong accumulation. The conventional medium-term target for the
rally is: 4250 + (4250 - 3900) = 4600. While a more aggressive
longer-term target would be 5000, calculated by projecting the
previous up-swing from its' peak: 4250 + (4250 - 3450) =
5050.
The All Ords is in a strong primary up-trend, but always keep a weather eye on the S&P 500.
The All Ords is in a strong primary up-trend, but always keep a weather eye on the S&P 500.
For further assistance, read About
the Trading Diary.
Colin Twiggs
Character isn't something you were born with and can't change,
like your fingerprints.
It's something you weren't born with and must take responsibility for forming.
~ Jim Rohn
It's something you weren't born with and must take responsibility for forming.
~ Jim Rohn
Back Issues
Access the Trading Diary Archives.

Author: Colin Twiggs is a former investment banker with almost 40 years of experience in financial markets. He co-founded Incredible Charts and writes the popular Trading Diary and Patient Investor newsletters.
Using a top-down approach, Colin identifies key macro trends in the global economy before evaluating selected opportunities using a combination of fundamental and technical analysis.
Focusing on interest rates and financial market liquidity as primary drivers of the economic cycle, he warned of the 2008/2009 and 2020 bear markets well ahead of actual events.
He founded PVT Capital (AFSL No. 546090) in May 2023, which offers investment strategy and advice to wholesale clients.