Trading Diary
September 17, 2005
These extracts from my daily trading diary are
for educational purposes and should not be interpreted as
investment advice. Full terms and conditions can be found at
Terms
of Use.
USA
The S&P 500 started the week with consolidation at [1] followed by a short (bullish) down-swing. Further consolidation at [4] preceded a strong blue candle [5] and the index appears headed for another test of resistance at 1245. A close above 1245 would complete a bullish cup and handle pattern, with the cup from [A] to [1].
Exceptional volume on Friday [5] is attributable to triple-witching hour. Contracts for stock index futures, stock index options and stock options simultaneously expire on the third Friday of March, June, September and December. The last hour of trading is highly volatile as traders attempt to close their positions.
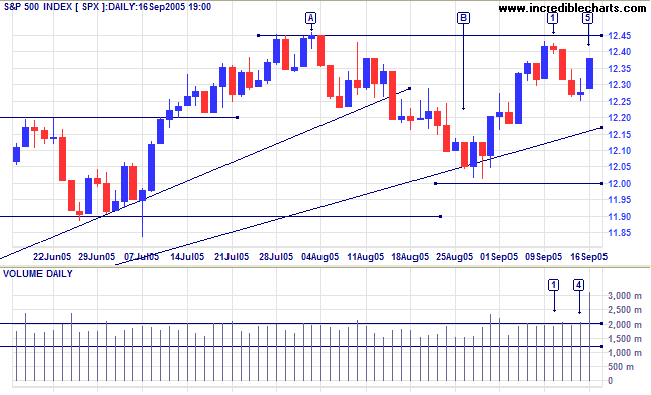
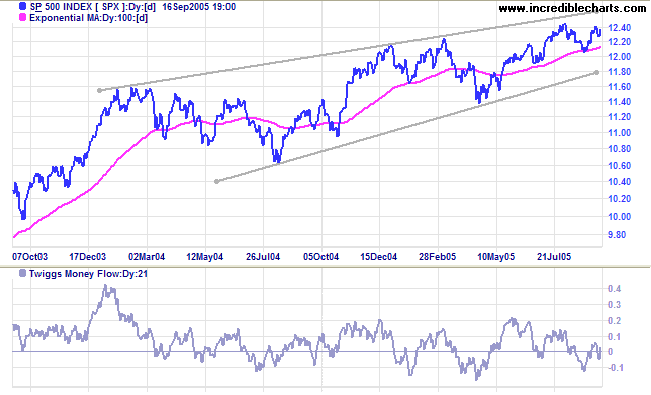
The primary trend is up, but we still have this tiresome
rising wedge pattern. Completion of the cup and handle
pattern would be a bullish sign for the entire market. The target
is almost 1300, which would mean a breakout from the larger wedge
pattern: 1245 + (1245 - 1200) = 1290.
Twiggs Money Flow (21-day) is looking bullish, having crossed
to above zero after a short retracement.
Primary support is at 1140.
Primary support is at 1140.
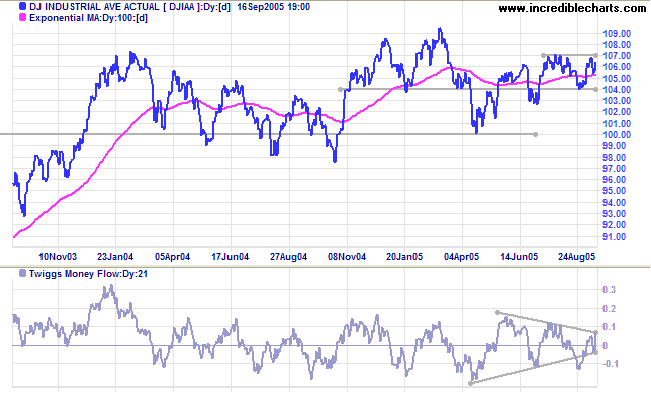
The Dow Industrial Average is headed for another test of
resistance at 10700 after a short (bullish) retracement. Failure
to breach that level would warn of a test of primary support at
10000. However,
Twiggs Money Flow (21-day) is looking bullish, having risen
to above zero, and a breakout is a distinct possibility. The
target would be the upper border of the long-term consolidation
pattern: 10700 + (10700 - 10400) = 11000
Expect strong resistance at 11000 and strong support at 10000. The most likely scenario is for the Dow to range between 10000 and 11000 for some time; restraining advances on the other major US indices.
Expect strong resistance at 11000 and strong support at 10000. The most likely scenario is for the Dow to range between 10000 and 11000 for some time; restraining advances on the other major US indices.
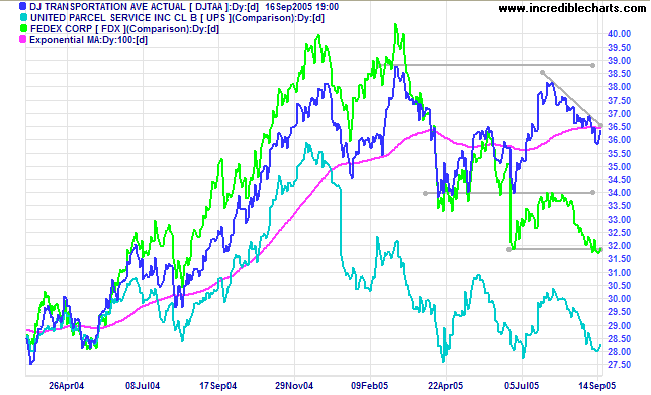
The Dow Jones Transportation Average is forming a top,
having started a secondary correction below the previous high of
3900; also reflected by the flat 100-day MA. Fedex has only made
a marginal break below support at its June 2005 low; which could
easily turn into a bear trap. UPS is a little way behind,
currently testing support. If both stocks resume their primary
down-trend, we could see the index follow suit.
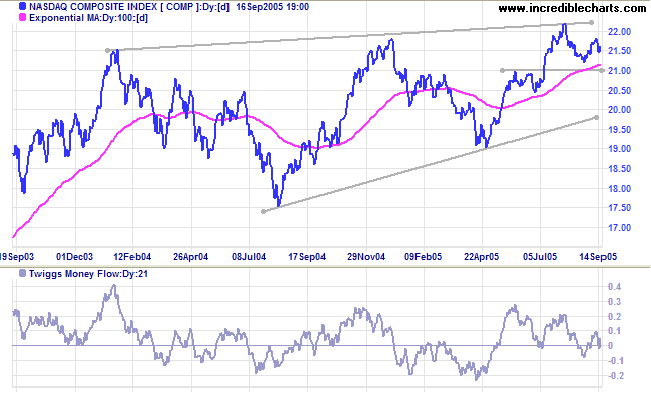
The Nasdaq Composite has held above support at 2100 and
appears headed for a test of the upper border of the bearish
rising wedge pattern. The crucial question is: does the index
have sufficient strength to break out?
Twiggs Money Flow (21-day) has recovered above zero but does
not yet appear strong enough.
Primary support is at 1900.
Primary support is at 1900.
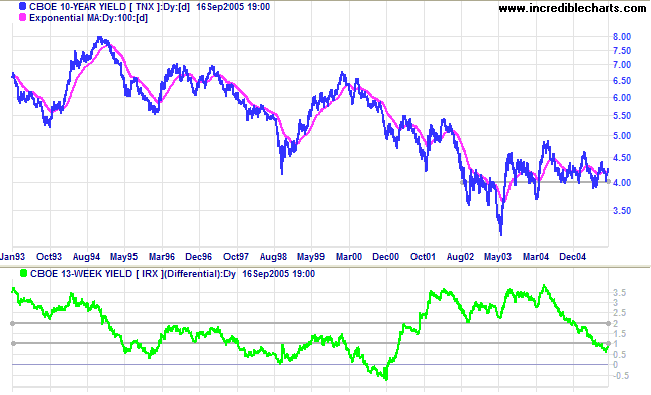
Treasury yields
Long-bond yields are consolidating above 4.0%. The yield differential (10-year T-notes minus 13-week T-bills) is below 1%, signaling a flat yield curve. This squeezes bank margins and is a bearish signal for equity markets. A negative yield curve, where the yield differential is below zero, is normally followed by a strong down-turn in equity markets in about 12 months.
Long-bond yields are consolidating above 4.0%. The yield differential (10-year T-notes minus 13-week T-bills) is below 1%, signaling a flat yield curve. This squeezes bank margins and is a bearish signal for equity markets. A negative yield curve, where the yield differential is below zero, is normally followed by a strong down-turn in equity markets in about 12 months.
Gold
New York: Spot gold broke through resistance at $450, closing at $459.00 on Friday to reach a 17-year high. The metal now faces clear skies overhead and should rally strongly towards $500. However, we cannot rule out the possibility of a pull-back to test the new support level.
New York: Spot gold broke through resistance at $450, closing at $459.00 on Friday to reach a 17-year high. The metal now faces clear skies overhead and should rally strongly towards $500. However, we cannot rule out the possibility of a pull-back to test the new support level.
United Kingdom
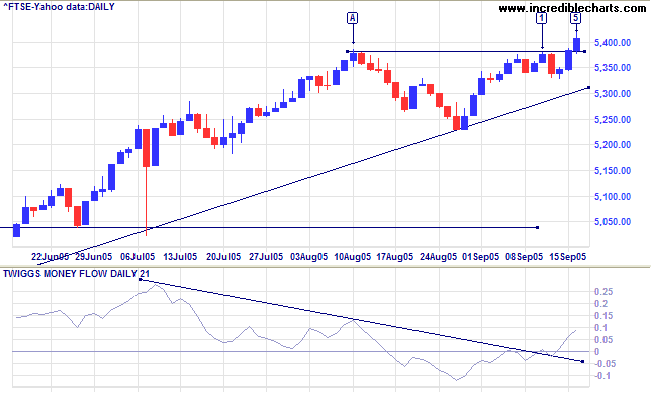
The FTSE 100 started the week with low volumes, consolidating below resistance at 5380, before the breakout out on strong volume at [5] completed a cup and handle pattern. The cup extends from [A] to [1], while the handle lasts from Monday [1] to Thursday. The target is: 5380 + (5380 - 5230) = 5530.
Twiggs Money Flow (21-day) crossed above zero, to signal accumulation.
The primary trend is upward. There may be some remaining resistance at 5400, but expect resistance to increase between 6000 and 6900.
Japan
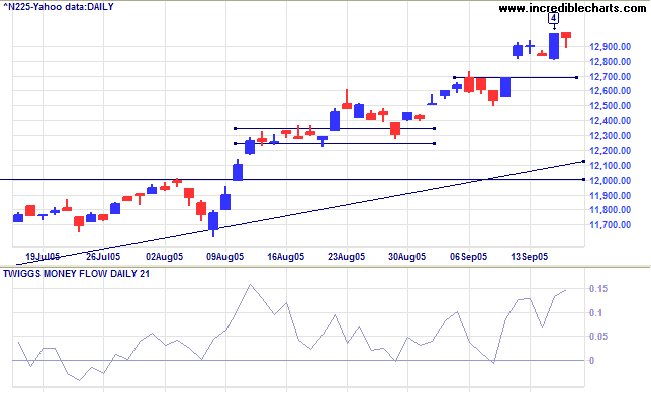
The Nikkei 225 continues in a strong up-trend. The week started with a gap above resistance at 12700, followed by two days of consolidation before a strong blue candle at [4]. High volumes on Thursday [4] signal short-term exhaustion, but sellers made little impression on Friday; the day ending with a long tail.
Twiggs Money Flow (21-day) climbed higher above the zero line, signaling strong accumulation. The long-term target for the breakout is 16400: 12000 + ( 12000 - 7600 [the April 2003 low]).
ASX Australia
The All Ordinaries again demonstrated the power of a bull market. Starting the week slowly on low volume [1], the index then rallied to test resistance at 4460 with low volume indicating an absence of sellers. A close above 4460 on Wednesday was met by strong selling at [4], the compressed spring (narrow range accompanied by high volume) signaling fierce opposition from buyers and sellers. Compressed springs are normally followed by a strong move like the rally (to 4500) on Friday, when resistance failed.
The All Ordinaries again demonstrated the power of a bull market. Starting the week slowly on low volume [1], the index then rallied to test resistance at 4460 with low volume indicating an absence of sellers. A close above 4460 on Wednesday was met by strong selling at [4], the compressed spring (narrow range accompanied by high volume) signaling fierce opposition from buyers and sellers. Compressed springs are normally followed by a strong move like the rally (to 4500) on Friday, when resistance failed.
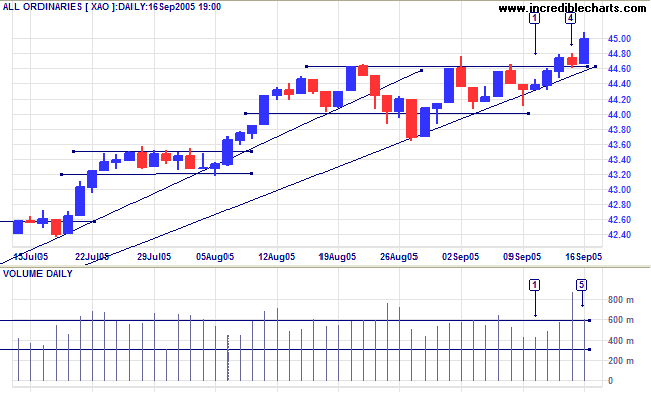
Twiggs Money Flow (21-day) remains high above zero, signaling
strong accumulation. The conventional target for the rally is
calculated:
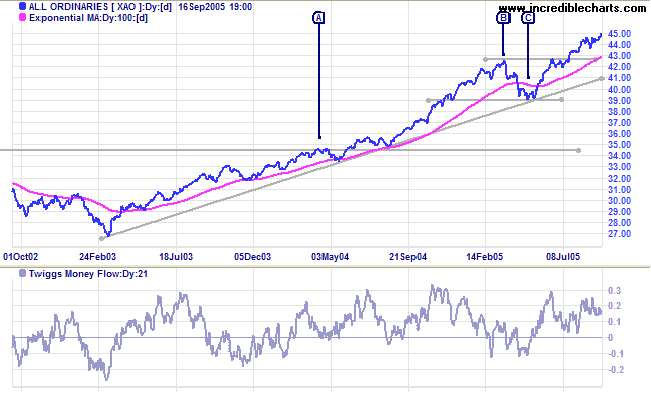
4250 [B] + (4250 - 3900 [C]) = 4600. While a more aggressive target would be 5000, calculated by projecting the previous up-swing from its' peak: 4250 [B] + (4250 - 3450 [A]) = 5050.
The All Ords does not function in isolation, however. We need to keep a weather eye on the S&P 500.
4250 [B] + (4250 - 3900 [C]) = 4600. While a more aggressive target would be 5000, calculated by projecting the previous up-swing from its' peak: 4250 [B] + (4250 - 3450 [A]) = 5050.
The All Ords does not function in isolation, however. We need to keep a weather eye on the S&P 500.
For further assistance, read About
the Trading Diary.
Colin Twiggs
I find it fascinating that most people plan their vacations with
better care than they plan their lives.
Perhaps that is because escape is easier than change.
~ Jim Rohn
Perhaps that is because escape is easier than change.
~ Jim Rohn
Back Issues
Access the Trading Diary Archives.

Author: Colin Twiggs is a former investment banker with almost 40 years of experience in financial markets. He co-founded Incredible Charts and writes the popular Trading Diary and Patient Investor newsletters.
Using a top-down approach, Colin identifies key macro trends in the global economy before evaluating selected opportunities using a combination of fundamental and technical analysis.
Focusing on interest rates and financial market liquidity as primary drivers of the economic cycle, he warned of the 2008/2009 and 2020 bear markets well ahead of actual events.
He founded PVT Capital (AFSL No. 546090) in May 2023, which offers investment strategy and advice to wholesale clients.