Trading Diary
September 10, 2005
These extracts from my daily trading diary are
for educational purposes and should not be interpreted as
investment advice. Full terms and conditions can be found at
Terms
of Use.
USA
The short week has been good for the S&P 500, with strong blue candles on Tuesday [1] and Friday [4]. Narrow range and strong volume at [2] reveals selling into the trend, but this was overcome by buying pressure. Strong volume on Friday [4] signals further resistance and we may face consolidation or a reversal at the 1245 resistance level.
The short week has been good for the S&P 500, with strong blue candles on Tuesday [1] and Friday [4]. Narrow range and strong volume at [2] reveals selling into the trend, but this was overcome by buying pressure. Strong volume on Friday [4] signals further resistance and we may face consolidation or a reversal at the 1245 resistance level.
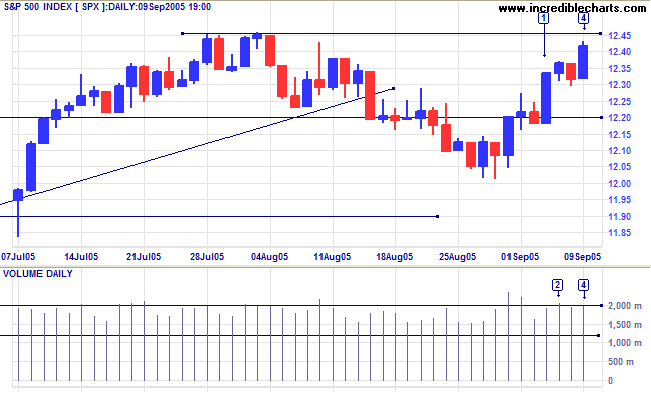
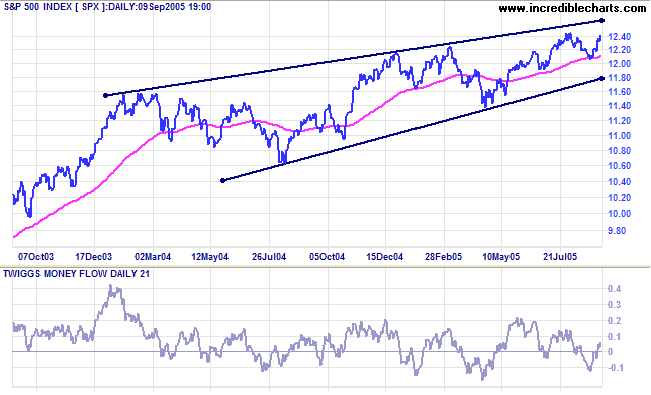
The primary trend is up, but we still have this tiresome
rising wedge pattern: a downward breakout would warn of a
primary trend reversal.
Twiggs Money Flow (21-day) is not particularly strong,
whipsawing around zero. Primary support is at 1140.
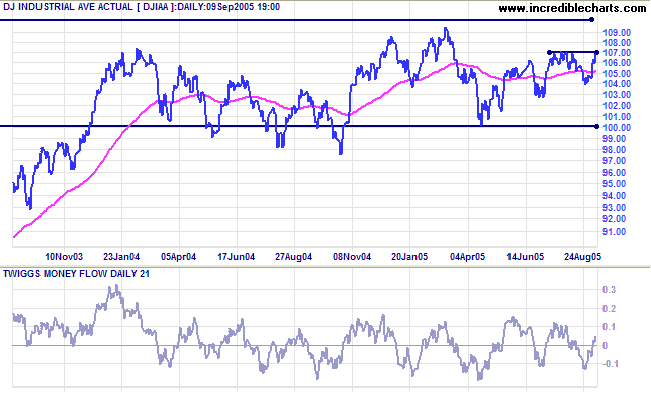
The Dow Industrial Average is edging slowly upward, having
recovered to test resistance at 10700. Failure to breach that
level would warn of a test of primary support at 10000.
Twiggs Money Flow (21-day) is whipsawing around zero with no
strong signal.
Expect strong resistance overhead at 11000 to 11500, and strong support at 10000. The most likely scenario is for the Dow to range between 10000 and 11000 for some time -- restraining advances on the S&P 500 and NASDAQ indices.
Expect strong resistance overhead at 11000 to 11500, and strong support at 10000. The most likely scenario is for the Dow to range between 10000 and 11000 for some time -- restraining advances on the S&P 500 and NASDAQ indices.
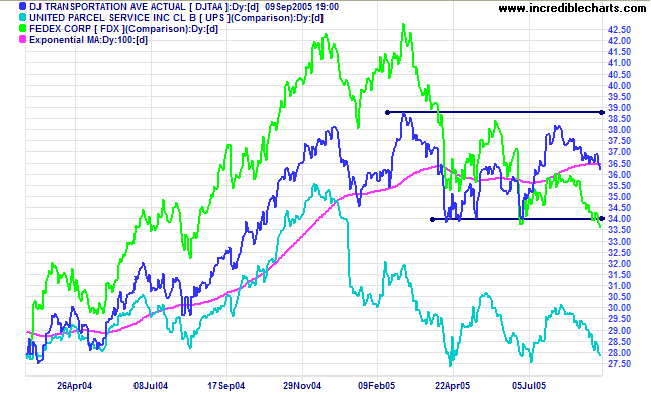
The Dow Jones Transportation Average is in a primary
up-trend, but appears to be forming a top, having started a
secondary correction below the previous high of 3900. Also
reflected by the flat 100-day MA. Fedex broke through support to
resume its' primary down-trend. If UPS, currently testing
support, follows suit, then we could see the index dragged
downwards.
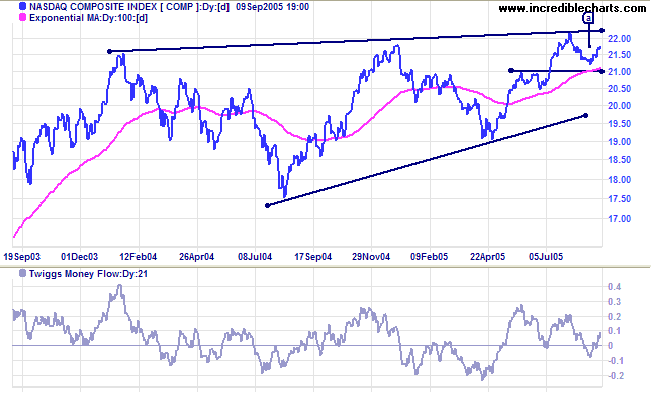
The Nasdaq Composite is stronger than the S&P 500 and
Dow at present, having respected support at 2100 with a space
between the trough and the previous peak (see
Blind Freddy Trends). The crucial question is: does the index
have sufficient strength to break out above the bearish
rising wedge pattern.
Twiggs Money Flow (21-day) is whipsawing around zero and does
not show sufficient strength for a breakout.
Though unlikely at present, a close below lower border of the bearish rising wedge pattern, or primary support at 1900, would signal the start of a primary down-trend.
Though unlikely at present, a close below lower border of the bearish rising wedge pattern, or primary support at 1900, would signal the start of a primary down-trend.
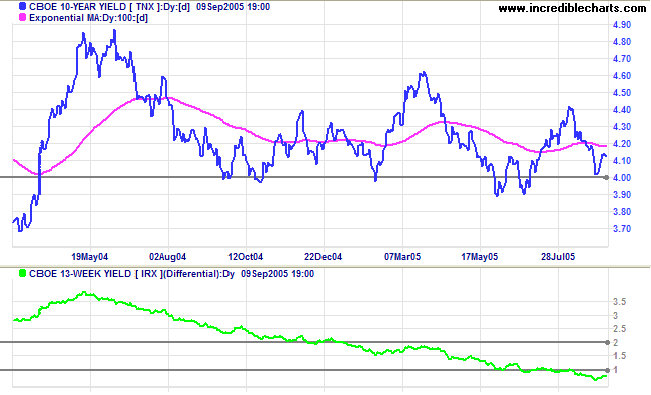
Treasury yields
Long-bond yields respected support at 4.0% before recovering slightly. The long-term scenario looks weak, however, with lower peaks forming a large descending triangle. The yield differential (10-year T-notes minus 13-week T-bills) is below 1%, squeezing bank margins. A flat yield curve is detrimental to the profitability of banks (who pay mostly short-term rates to depositors while charging long-term rates to borrowers) and a long-term bear signal for the entire equity market.
Long-bond yields respected support at 4.0% before recovering slightly. The long-term scenario looks weak, however, with lower peaks forming a large descending triangle. The yield differential (10-year T-notes minus 13-week T-bills) is below 1%, squeezing bank margins. A flat yield curve is detrimental to the profitability of banks (who pay mostly short-term rates to depositors while charging long-term rates to borrowers) and a long-term bear signal for the entire equity market.
Gold
New York: Spot gold is testing resistance at $450, closing at $448.50 on Friday. The metal is in a clear up-trend but must overcome a strong band of resistance between $450 and $454 (from the December 2004 high) before it can achieve lift-off.
New York: Spot gold is testing resistance at $450, closing at $448.50 on Friday. The metal is in a clear up-trend but must overcome a strong band of resistance between $450 and $454 (from the December 2004 high) before it can achieve lift-off.
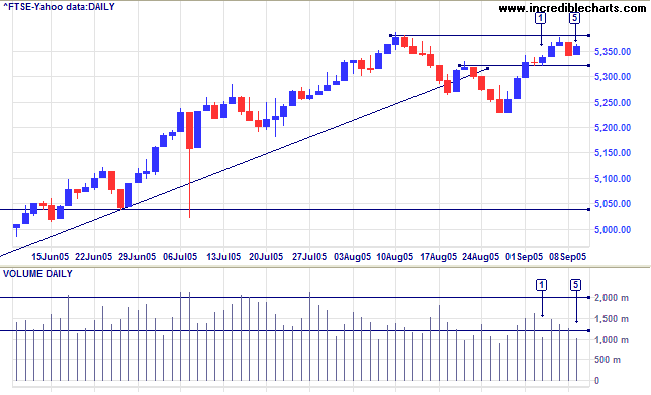
United Kingdom
The FTSE 100 made some gains since last week but on very light volume, evident at [1] and [5]. This indicates a lack of enthusiasm from buyers and we may see further consolidation below resistance at 5380. Twiggs Money Flow (21-day) paints a similar picture, having remaining below zero since mid-August, to signal distribution.
A close above 5380, on the other hand, would negate this.
The primary trend is upward, with overhead resistance at 5400 and heavy resistance expected at 6000 to 6800.
Japan
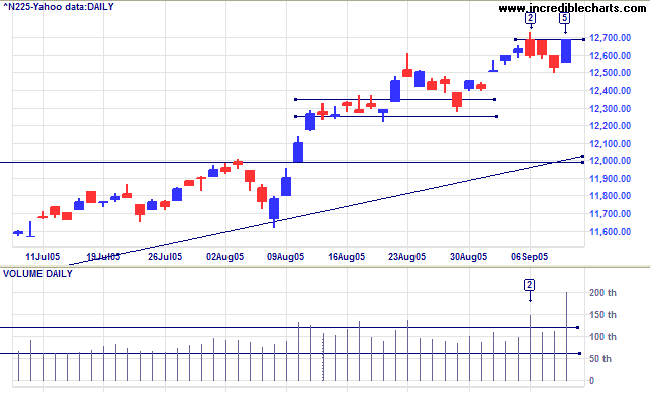
The Nikkei 225 is in a strong up-trend, with Twiggs Money Flow (21-day) forming 3 successive troughs above the signal line to signal strong accumulation. However, resistance is now evident at 12700, with a red candle and strong volume at [2] and very high volume at [5]. We may see further consolidation, or a correction, before the primary trend resumes.
The long-term target for the breakout is 16400: 12000 + ( 12000 - 7600 [the April 2003 low]).
ASX Australia
The All Ordinaries is consolidating in a narrow range below resistance at the previous highs: a bullish sign. Monday's longish tail and high volume signal support, but strong volume on Wednesday [3] indicated a possible blow-off, confirmed by the following day's reversal. There have been three tall blue candles since the last tall red candle, a sign that the market is bullish at present. A view echoed by the long tail and low volume on Friday [5], signaling sellers' lack of interest. A close above 4460 would signal resumption of the up-trend.
The All Ordinaries is consolidating in a narrow range below resistance at the previous highs: a bullish sign. Monday's longish tail and high volume signal support, but strong volume on Wednesday [3] indicated a possible blow-off, confirmed by the following day's reversal. There have been three tall blue candles since the last tall red candle, a sign that the market is bullish at present. A view echoed by the long tail and low volume on Friday [5], signaling sellers' lack of interest. A close above 4460 would signal resumption of the up-trend.
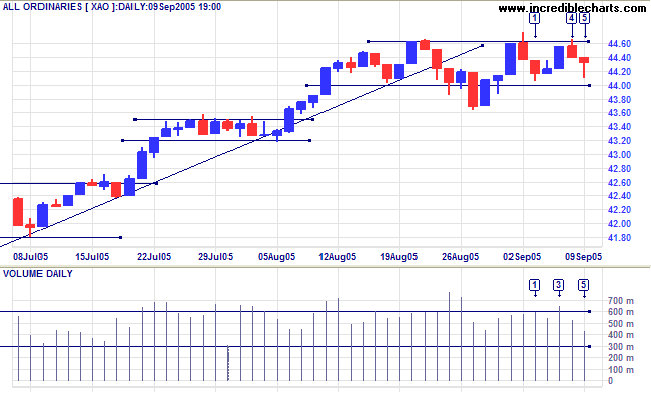
It is taken some time for me to wake up to the strength of this
bull market, but
Twiggs Money Flow (21-day) has remained well above zero,
signaling strong accumulation. The conventional target for the
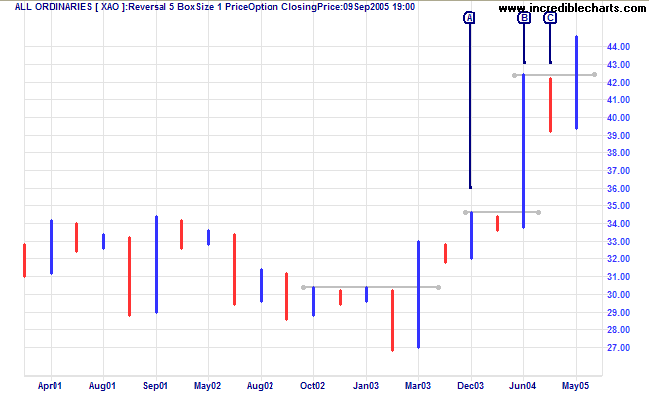
rally is 4600: 4250 [B] + (4250 - 3900 [C]). A more aggressive
target would be 5000, calculated by projecting the previous
up-swing from its' peak: 4250 [B] + (4250 - 3450 [A]) =
5050.
The All Ords does not function in isolation, however. Performance may be affected by major indexes, especially the S&P 500, which should be watched closely.
The All Ords does not function in isolation, however. Performance may be affected by major indexes, especially the S&P 500, which should be watched closely.
For further assistance, read About
the Trading Diary.
Colin Twiggs
Shallow men believe in luck.
Strong men believe in cause and effect.
~ Ralph Waldo Emerson
Strong men believe in cause and effect.
~ Ralph Waldo Emerson
Back Issues
Access the Trading Diary Archives.

Author: Colin Twiggs is a former investment banker with almost 40 years of experience in financial markets. He co-founded Incredible Charts and writes the popular Trading Diary and Patient Investor newsletters.
Using a top-down approach, Colin identifies key macro trends in the global economy before evaluating selected opportunities using a combination of fundamental and technical analysis.
Focusing on interest rates and financial market liquidity as primary drivers of the economic cycle, he warned of the 2008/2009 and 2020 bear markets well ahead of actual events.
He founded PVT Capital (AFSL No. 546090) in May 2023, which offers investment strategy and advice to wholesale clients.