Trading Diary
September 3, 2005
These extracts from my daily trading diary are
for educational purposes and should not be interpreted as
investment advice. Full terms and conditions can be found at
Terms
of Use.
USA
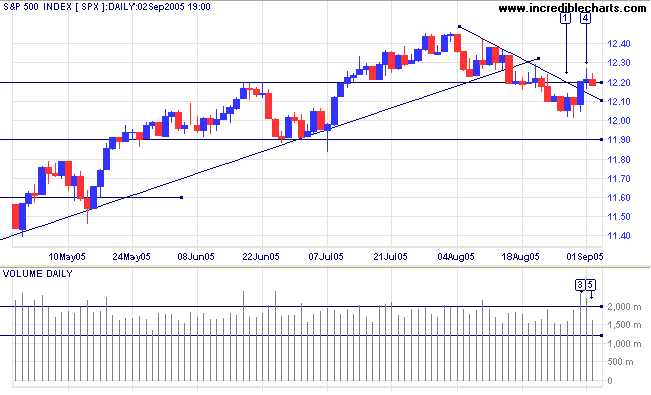
The S&P 500 encountered support at 1200, on Monday [1] and Tuesday, before the rally on Wednesday penetrated the downward trendline, signaling a loss of momentum. Strong volume [3] often signals a short-term blow-off and Thursday signaled resistance with a weak close and continued high volume. Friday eased back below 1220 on lighter volume, signaling the start of another possible down-swing.
Reversal above the high of [4] would signal that the secondary correction has ended; while a close below 1200, the low of [1], would signal further weakness. A down-swing that respects the trendline would be a bullish sign.
The primary trend is up, continuing to display unusually high
(weekly) volume, while low 63-day Volatility
warns of a strong move ahead but gives no indication of
direction. The index has failed to break out of a bearish
rising wedge pattern, and now appears to be headed for a test
of the lower border, while
Twiggs Money Flow (21-day) is below zero, signaling
distribution. Primary support is at 1140.
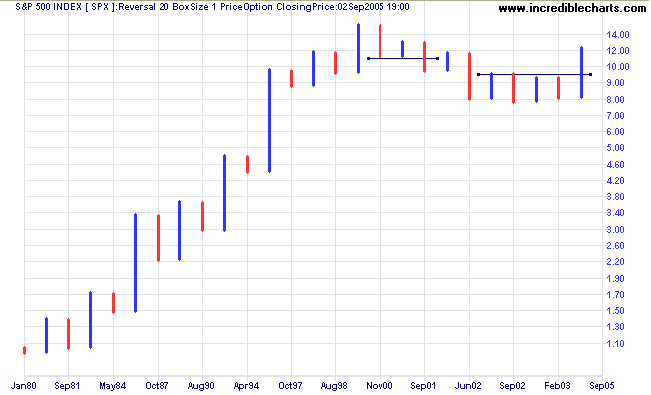
The 25-year point and figure chart below displays what I refer to as the "mega-trend". A higher low in 2003 followed by a new high signals that the market is in a bull phase. If there is a reversal of the primary trend, it is unlikely to fall below 950 (or 1000) and seriously threaten the mega-trend. The real test will come when the index encounters resistance at 1500 (the previous high).
The 25-year point and figure chart below displays what I refer to as the "mega-trend". A higher low in 2003 followed by a new high signals that the market is in a bull phase. If there is a reversal of the primary trend, it is unlikely to fall below 950 (or 1000) and seriously threaten the mega-trend. The real test will come when the index encounters resistance at 1500 (the previous high).
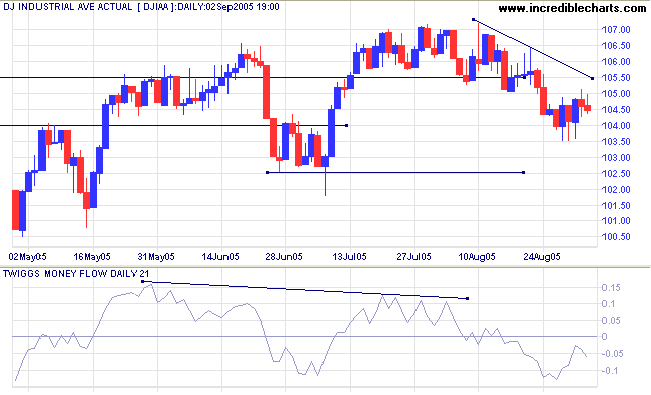
The Dow Industrial Average appears headed for a test of
secondary support at 10250. A breach of that level would result
in a test of primary support at 10000.
Twiggs Money Flow (21-day) below zero signals
distribution.
Expect strong resistance overhead at 11000 to 11500, and strong support at 10000. The most likely scenario is for the Dow to range between 10000 and 11000 for some time; which may restrain advances on the S&P 500 and NASDAQ indices.
Expect strong resistance overhead at 11000 to 11500, and strong support at 10000. The most likely scenario is for the Dow to range between 10000 and 11000 for some time; which may restrain advances on the S&P 500 and NASDAQ indices.
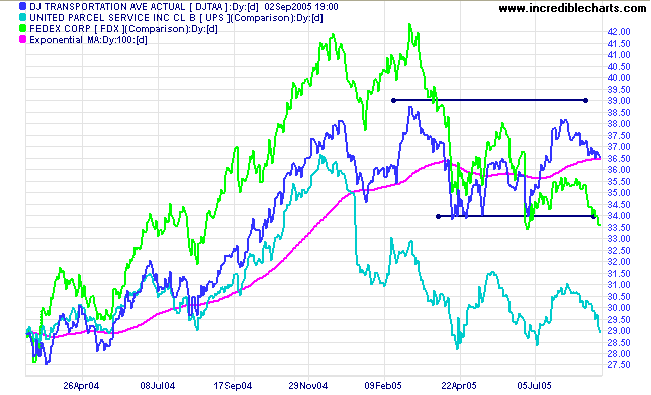
The Dow Jones Transportation Average is in a primary
up-trend, but has started a secondary correction. Both UPS and
Fedex are testing support, while in a primary down-trend: a
bearish sign for the index.
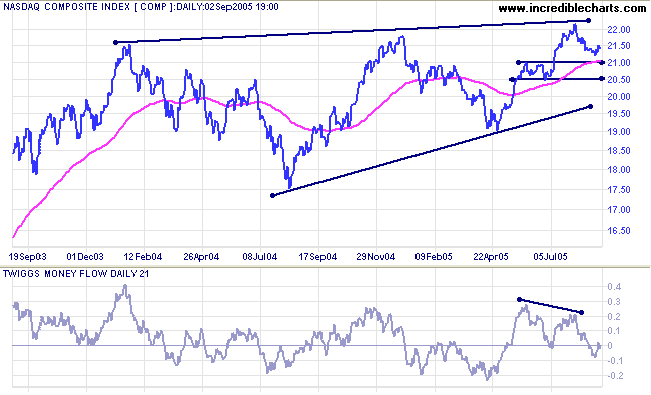
The Nasdaq Composite appears stronger than the S&P 500
and the Dow, having so far respected initial support at 2100. It
will be a bullish sign if support holds, warning of a possible
breakout from the bearish
rising wedge pattern.
Twiggs Money Flow (21-day), however, having crossed below the
zero line, signals
distribution; and a fall below 2050 would test the lower
border of the pattern.
A close below 1900 would signal the start of a primary down-trend.
A close below 1900 would signal the start of a primary down-trend.
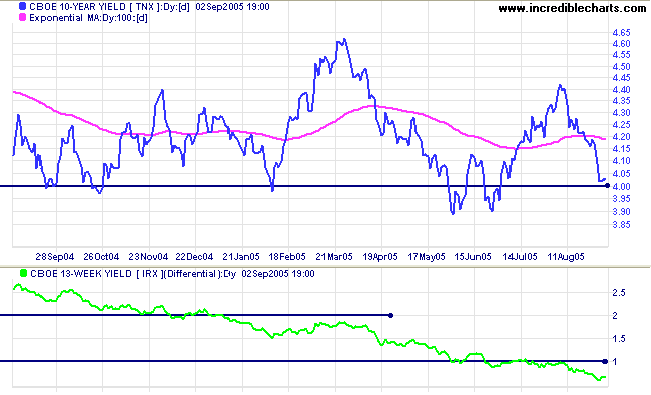
Treasury yields
Long-bond yields have fallen back to 4.0%; a negative long-term sign for equities. And the yield differential (10-year T-notes minus 13-week T-bills) is well below 1%, squeezing bank margins. A flat yield curve is detrimental to the profitability of banks, who pay mostly short-term rates to depositors while charging long-term rates to borrowers, and a long-term bear signal for the entire equity market.
This conflicts with the message from the S&P 500 mega-trends chart; so we need to be cautious.
Gold
New York: After breaking out from a large symmetrical triangle, spot gold pulled back to test the upper border of the triangle, finding support at $430. The metal since rallied strongly, closing Friday at $442.80, and there is now a clear up-trend (higher high followed by higher low). The target for the breakout is $484: 440 + (454 - 410), but expect resistance at $450 to $454.
New York: After breaking out from a large symmetrical triangle, spot gold pulled back to test the upper border of the triangle, finding support at $430. The metal since rallied strongly, closing Friday at $442.80, and there is now a clear up-trend (higher high followed by higher low). The target for the breakout is $484: 440 + (454 - 410), but expect resistance at $450 to $454.
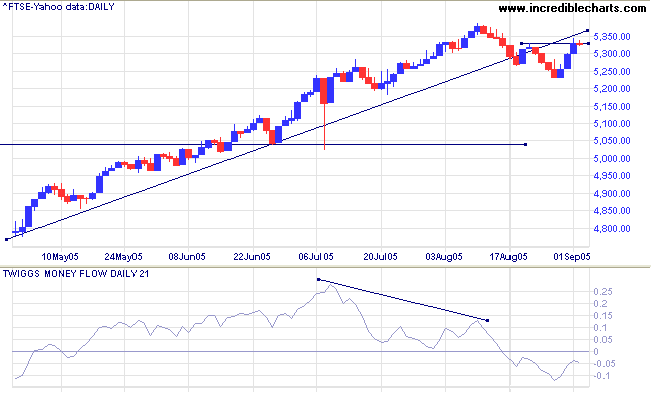
United Kingdom
The FTSE 100 pulled back to test resistance at the previous short-term high. Further gains would signal the end of a very short secondary correction: a strong bull signal for the primary trend. Twiggs Money Flow (21-day), however, remains below the zero line, signaling distribution. This would be negated if there is an upward breakout in the next few days.
The primary trend is upward, with some overhead resistance at 5400 and heavy resistance likely at 6000 to 6800.
Japan
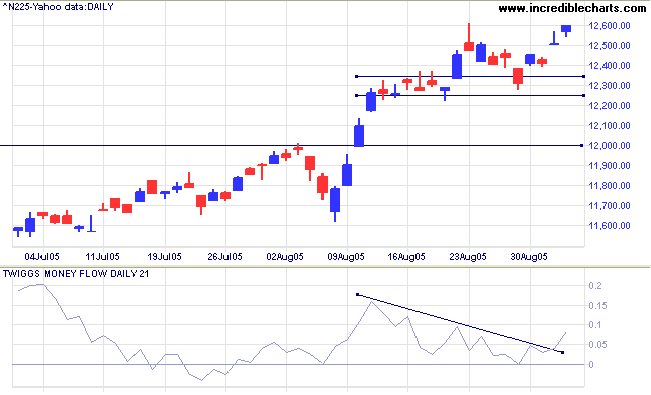
The Nikkei 225 is in a strong up-trend since the breakout above 12000. The latest short-term retracement respected support at 12250 and appears headed for new highs. Twiggs Money Flow (21-day) signals accumulation, having rallied to form a trough above the zero line.
The long-term target for the breakout is 16400: 12000 + ( 12000 - 7600 <the April 2003 low>).
ASX Australia
The All Ordinaries fell sharply on Monday [1] before rallying on moderate volume back to resistance at 4460. Friday's tall shadow and weak close suggest another down-swing. The trendline break from late August warns that momentum is slowing and a close below 4360 would signal another secondary correction.
The All Ordinaries fell sharply on Monday [1] before rallying on moderate volume back to resistance at 4460. Friday's tall shadow and weak close suggest another down-swing. The trendline break from late August warns that momentum is slowing and a close below 4360 would signal another secondary correction.
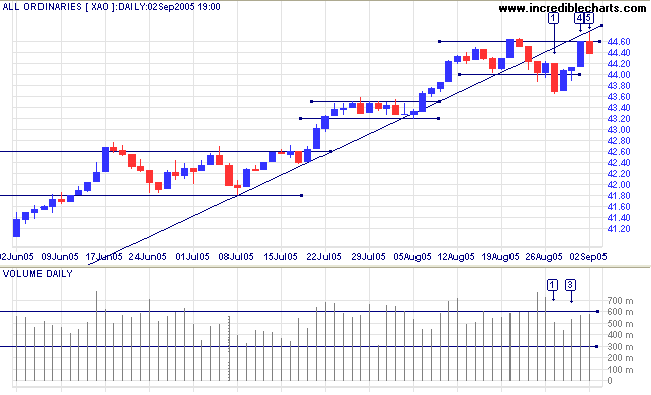
However, the index is in a primary up-trend (and you don't bet
against the trend). Consensus on the Chart
Forum appears to be that there is life in the old dog yet and
Twiggs Money Flow (21-day) supports this view, with frequent
troughs above zero signaling strong accumulation. The target for
the present rally is 4600: 4250 + (4250 - 3900).
A note of caution: The S&P 500 has a major influence over the behavior of the All Ords and should be watched closely.
A note of caution: The S&P 500 has a major influence over the behavior of the All Ords and should be watched closely.
For further assistance, read About
the Trading Diary.
Colin Twiggs
It's easy to make a buck.
It's a lot tougher to make a difference.
~ Tom Brokaw
It's a lot tougher to make a difference.
~ Tom Brokaw
Back Issues
Access the Trading Diary Archives.

Author: Colin Twiggs is a former investment banker with almost 40 years of experience in financial markets. He co-founded Incredible Charts and writes the popular Trading Diary and Patient Investor newsletters.
Using a top-down approach, Colin identifies key macro trends in the global economy before evaluating selected opportunities using a combination of fundamental and technical analysis.
Focusing on interest rates and financial market liquidity as primary drivers of the economic cycle, he warned of the 2008/2009 and 2020 bear markets well ahead of actual events.
He founded PVT Capital (AFSL No. 546090) in May 2023, which offers investment strategy and advice to wholesale clients.