Trading Diary
August 27, 2005
These extracts from my daily trading diary are
for educational purposes and should not be interpreted as
investment advice. Full terms and conditions can be found at
Terms
of Use.
USA
The S&P 500 is headed for a test of secondary support at 1190, and possibly primary support at 1140, after breaking below 1220. The tall shadow on Monday [1] indicates that sellers dominate; while the tall shadow and higher volume on Wednesday [3] shows how sellers snuffed out an attempted rally. Friday's [5] strong red candle confirms that sellers remain in control.
The S&P 500 is headed for a test of secondary support at 1190, and possibly primary support at 1140, after breaking below 1220. The tall shadow on Monday [1] indicates that sellers dominate; while the tall shadow and higher volume on Wednesday [3] shows how sellers snuffed out an attempted rally. Friday's [5] strong red candle confirms that sellers remain in control.
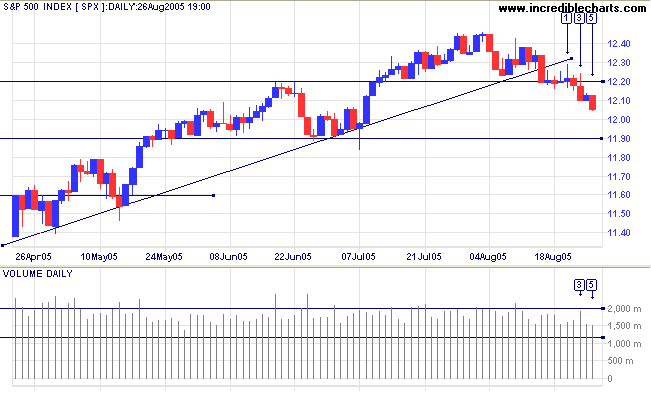
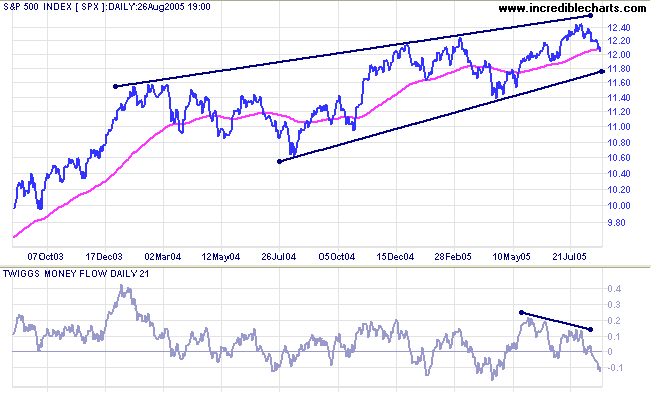
The big picture is bearish at present. The primary trend is up,
with unusually high (weekly) volumes, but
Twiggs Money Flow (21-day) has fallen sharply below the zero
line, signaling distribution. The index is headed for a test of
the lower border of the bearish
rising wedge pattern; a downside breakout would be a strong
bear signal. Volatility (63-day) remains low, warning that a
strong move may be imminent, but the direction remains
uncertain.
Primary support is at 1140; resistance at 1500.
Primary support is at 1140; resistance at 1500.
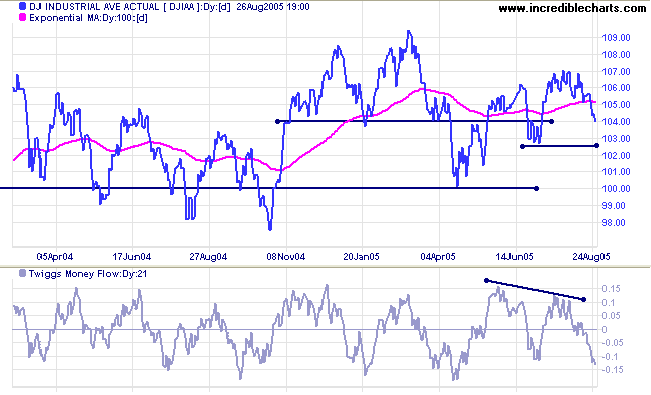
The Dow Industrial Average closed below 10500, signaling a
test of support at 10250. Failure of the intermediate support
level would result in a test primary support at 10000.
Twiggs Money Flow (21-day) has fallen sharply, signaling
distribution.
Expect strong support at 10000. The most likely scenario is for the Dow to range between 10000 and 11000 for some time.
Expect strong support at 10000. The most likely scenario is for the Dow to range between 10000 and 11000 for some time.
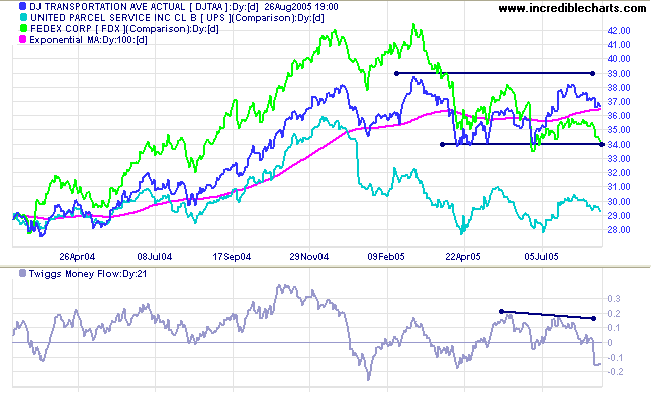
The Dow Jones Transportation Average is undergoing a
secondary correction, while
Twiggs Money Flow (21-day) has fallen sharply below zero,
signaling distribution. A fall below 3400 would signal a primary
trend reversal.
Both UPS and Fedex are in primary down-trends, with Twiggs Money Flow (21-day) signaling strong distribution: a bearish sign for the index.
Both UPS and Fedex are in primary down-trends, with Twiggs Money Flow (21-day) signaling strong distribution: a bearish sign for the index.
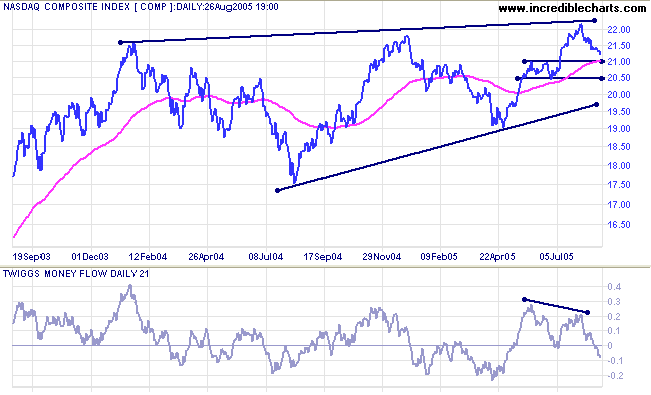
The Nasdaq Composite is headed for a test of intermediate
support at 2100/2050.
Twiggs Money Flow (21-day) has fallen sharply, signaling
distribution, after crossing below the zero line. An up-turn
above 2100 would be a bullish sign. A fall below 2050 would be
bearish, while a fall below the lower border of the bearish
rising wedge pattern, or primary support at 1900, would be a
strong bear signal. The long-term picture remains neutral until
then.
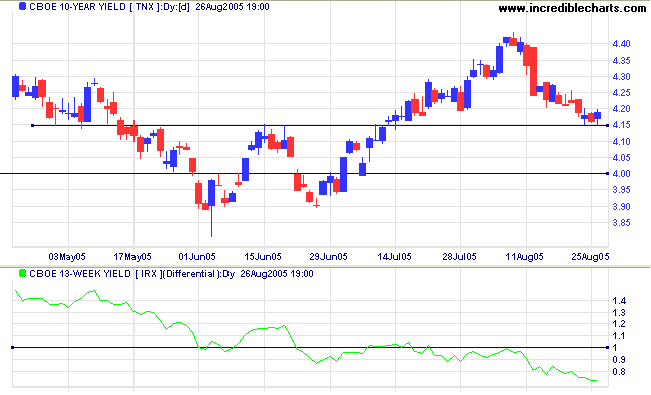
Treasury yields
The yield on 10-year treasury notes has so far held above support at 4.15% (the neckline from the recent double bottom), signaling that yields are still in positive territory. The yield differential (10-year T-notes minus 13-week T-bills) is below 1% and declining rapidly, squeezing bank margins. A flat yield curve (when the differential approaches zero) is detrimental to the profitability of banks, who pay mostly short-term rates to depositors while charging long-term rates to borrowers, and a long-term bear signal for the entire equity market.
The yield on 10-year treasury notes has so far held above support at 4.15% (the neckline from the recent double bottom), signaling that yields are still in positive territory. The yield differential (10-year T-notes minus 13-week T-bills) is below 1% and declining rapidly, squeezing bank margins. A flat yield curve (when the differential approaches zero) is detrimental to the profitability of banks, who pay mostly short-term rates to depositors while charging long-term rates to borrowers, and a long-term bear signal for the entire equity market.
Gold
Spot gold is consolidating in a narrow range between $435 and $440, closing at $436.80 on Friday. A breakout above the high is likely to test resistance at $450 to $454; a fall through the low is likely to test support at $420.
In the longer term, the metal is trending upwards and a break through resistance at $450/$454 would favor another primary trend move. The target for the breakout from the recent large symmetrical triangle is $484: 440 + (454 - 410).
United Kingdom
The FTSE 100 commenced a secondary correction, with a new low following a lower high on Monday. Twiggs Money Flow (21-day) has fallen sharply below zero, signaling distribution.
A correction that respects initial support at 5050/5040 (the February 2005 high) would confirm that the primary trend is strong; while failure of primary support at 4800 would signal a reversal.

Japan
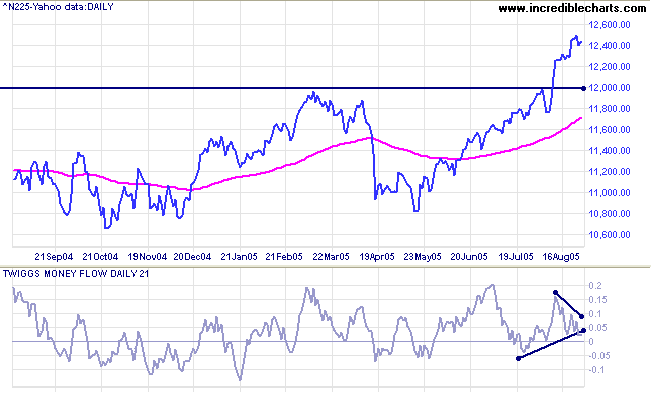
The Nikkei 225 broke upwards from a narrow consolidation last week, but a bearish divergence on Twiggs Money Flow (21-day) warns that a pull-back may be imminent. A retracement that respects 12000, or a false break below the new support level, would both signal continuation of the primary up-trend.
The long-term target for the breakout is 16400: 12000 + ( 12000 - 7600 <the April 2003 low>).
ASX Australia
After an initial breakout at [1] the All Ordinaries was dragged down by bearish sentiment in the US, testing support at 4400. Buying is evident on days [3] and [4], with long tails and strong volume. A further tail and strong close on Friday [5] signal accumulation from buyers. This would normally start another primary trend move but we need to be cautious because of the continued decline on the S&P 500. A close above the high of [1] would confirm a primary trend move; a close below 4400 would signal the start of a secondary correction.
After an initial breakout at [1] the All Ordinaries was dragged down by bearish sentiment in the US, testing support at 4400. Buying is evident on days [3] and [4], with long tails and strong volume. A further tail and strong close on Friday [5] signal accumulation from buyers. This would normally start another primary trend move but we need to be cautious because of the continued decline on the S&P 500. A close above the high of [1] would confirm a primary trend move; a close below 4400 would signal the start of a secondary correction.
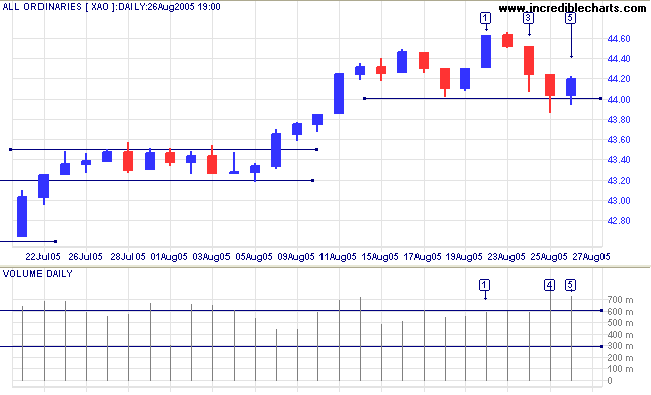
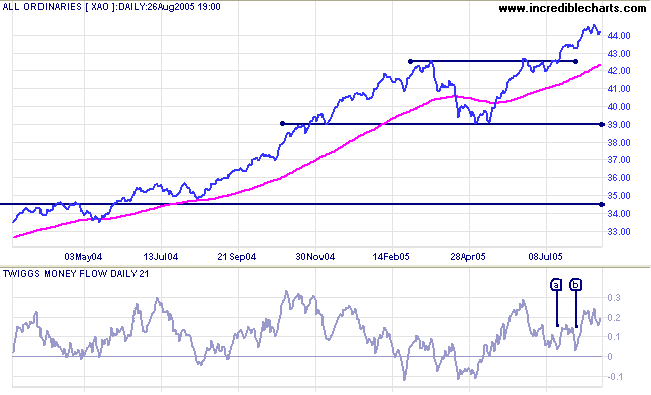
The index is in a primary up-trend and
Twiggs Money Flow (21-day) signals strong accumulation, well
above the zero line. The target for the present rally is 4600:
4250 + (4250 - 3900) but this is unlikely to be achieved if the
US markets continue to decline.
For further assistance, read About
the Trading Diary.
Colin Twiggs
I don't know the key to success,
but the key to failure is trying to please everybody.
~ Bill Cosby
but the key to failure is trying to please everybody.
~ Bill Cosby
Back Issues
Access the Trading Diary Archives.

Author: Colin Twiggs is a former investment banker with almost 40 years of experience in financial markets. He co-founded Incredible Charts and writes the popular Trading Diary and Patient Investor newsletters.
Using a top-down approach, Colin identifies key macro trends in the global economy before evaluating selected opportunities using a combination of fundamental and technical analysis.
Focusing on interest rates and financial market liquidity as primary drivers of the economic cycle, he warned of the 2008/2009 and 2020 bear markets well ahead of actual events.
He founded PVT Capital (AFSL No. 546090) in May 2023, which offers investment strategy and advice to wholesale clients.