Trading Diary
August 20, 2005
These extracts from my daily trading diary are
for educational purposes and should not be interpreted as
investment advice. Full terms and conditions can be found at
Terms
of Use.
USA
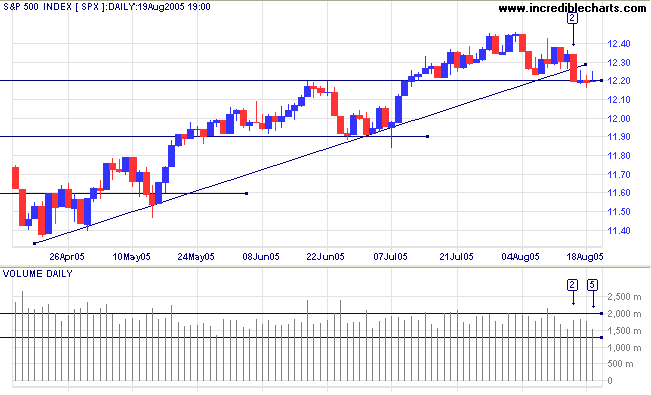
The S&P 500 is again testing support at 1220 after a sharp fall on Tuesday [2] broke below the trendline, signaling a slowing of momentum. The index has consolidated for the last three days in a narrow range at the support level. Weak closes and lower volume on Friday [5] favor a downside breakout; confirmation would be a close below Thursday's low. A downside breakout would signal a test of secondary support at 1190 and possibly primary support at 1140.
A close above 1240, on the other hand, would signal resumption of the up-trend, with a target of 1280: 1250 + (1250 - 1220).
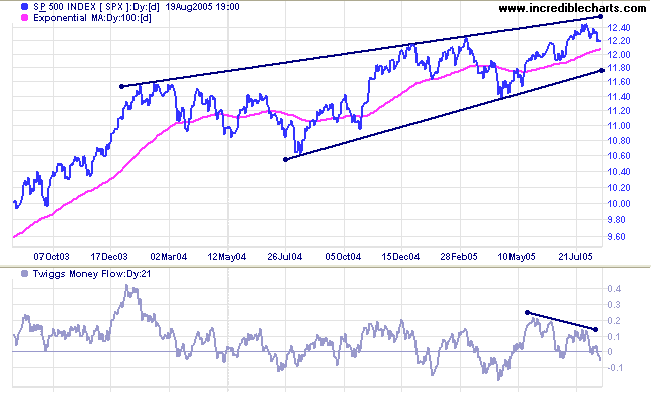
The big picture is acquiring a bearish hue. The primary trend is
up and displays unusually high (weekly) volumes, but
Twiggs Money Flow (21-day) crossed below the zero line after
a bearish
divergence, signaling distribution. The index has also failed
to break out of the bearish
rising wedge pattern and may now test its lower border. Low
63-day volatility warns of a strong move ahead but gives no
indication of the direction.
Primary support is at 1140; resistance at 1260, the upper border of the wedge pattern.
Primary support is at 1140; resistance at 1260, the upper border of the wedge pattern.
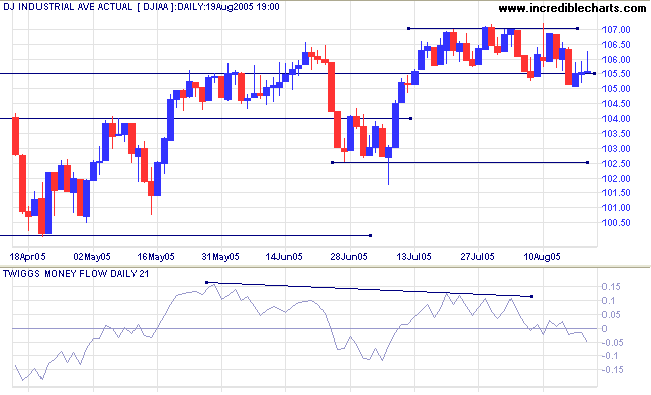
The Dow Industrial Average broke through support at 10550,
from the past few weeks consolidation. The sharp fall on Tuesday
immediately halted on Wednesday and was followed by an attempted
recovery Thursday/Friday. The recovery attempt displays low
volumes and weak closes, signaling further downside.
A close below 10500 would signal a test of support at 10250. Further, a breach of the intermediate support level would be likely to test primary support at 10000. Twiggs Money Flow (21-day) signals distribution, having crossed below the zero line after a bearish divergence.
Expect strong resistance overhead at 11000 to 11500, and strong support at 10000. The most likely scenario is for the Dow to range between 10000 and 11000 for some time; which may restrain advances on the S&P 500 and NASDAQ indices.
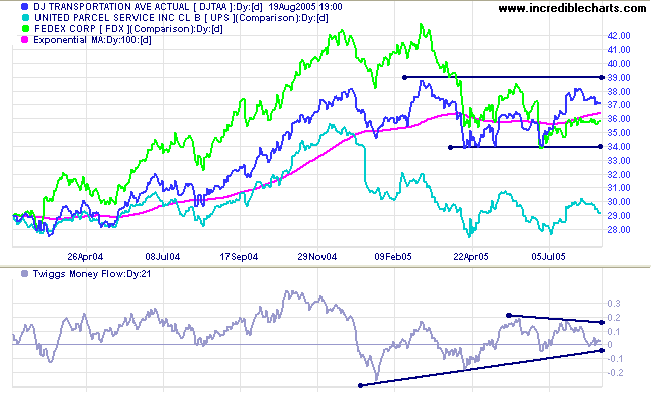
The Dow Jones Transportation Average is in a primary
up-trend, but has started a secondary correction. Watch for a
breakout from the triangle on
Twiggs Money Flow (21-day): a fall below zero would be
bearish, while another up-swing would be bullish. Both UPS and
Fedex are in a primary down-trend with
Twiggs Money Flow (21-day) signaling strong distribution: a
bearish sign for the index.
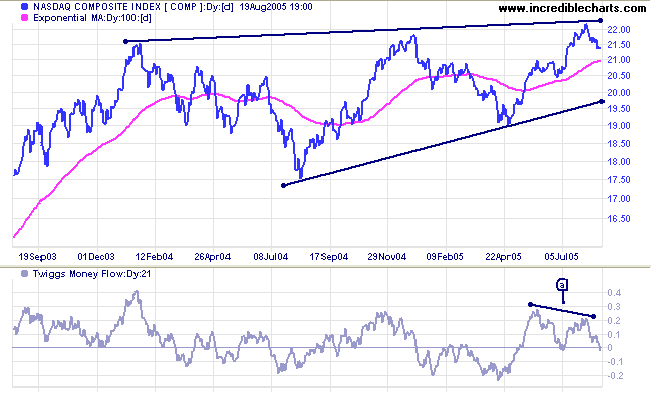
The Nasdaq Composite closed below support at 2150.
Twiggs Money Flow (21-day) signals distribution, having
crossed below the zero line after a bearish
divergence. An up-turn at this point would be a bull signal
signaling a possible rise above 2200, following the S&P 500
into a primary up-trend. However, any further losses would warn
of a test of support at 2000, the lower border of the bearish
rising wedge pattern.
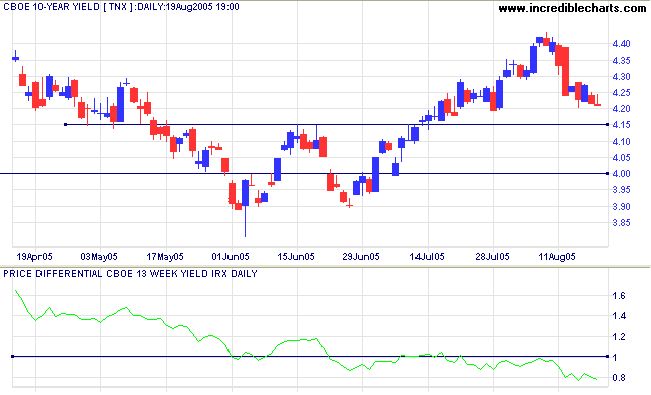
Treasury yields
Long-bond yields have fallen sharply on Fed hints that the string of rate hikes may be nearing an end. As long as yields hold above support at 4.15% (the neckline from the recent double bottom) yields are still in positive territory. The yield differential (10-year T-notes minus 13-week T-bills) is below 1% and falling, squeezing bank margins. A flat yield curve is detrimental to the profitability of banks, who pay mostly short-term rates to depositors while charging long-term rates to borrowers, and a long-term bear signal for the entire equity market.
Long-bond yields have fallen sharply on Fed hints that the string of rate hikes may be nearing an end. As long as yields hold above support at 4.15% (the neckline from the recent double bottom) yields are still in positive territory. The yield differential (10-year T-notes minus 13-week T-bills) is below 1% and falling, squeezing bank margins. A flat yield curve is detrimental to the profitability of banks, who pay mostly short-term rates to depositors while charging long-term rates to borrowers, and a long-term bear signal for the entire equity market.
Gold
New York: Following the breakout from a large symmetrical triangle, spot gold pulled back to test support at $435, closing Friday at $436.80. The target for the breakout is $484: 440 + (454 - 410), but there is strong resistance overhead at $450 to $454.
New York: Following the breakout from a large symmetrical triangle, spot gold pulled back to test support at $435, closing Friday at $436.80. The target for the breakout is $484: 440 + (454 - 410), but there is strong resistance overhead at $450 to $454.
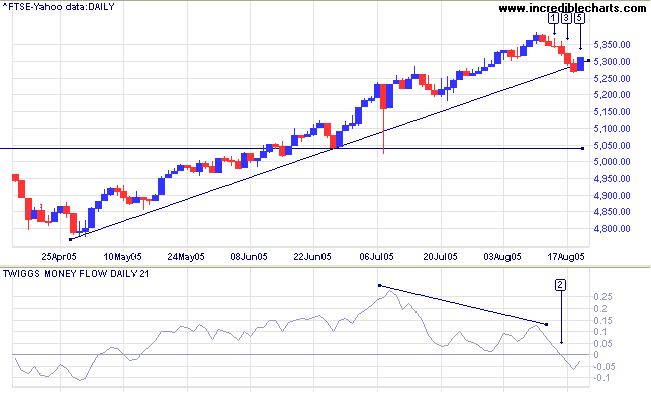
United Kingdom
After a slow start, the FTSE 100 retraced below the upward trendline, with 5 consecutive red candles and increased volume on Tuesday and Wednesday [3]. Twiggs Money Flow (21-day) crossed below the zero line on Tuesday [2], signaling distribution. Friday's recovery back above the trendline shows promise, with a tall blue candle and strong close, but low volume warns that buyers may not be committed. A follow-through early next week, with a close above the high of [5], would signal that the primary trend has resumed; while a close below Thursday's low, or a narrow consolidation, would favor a test of support at 5200 (and possibly primary support at 5040 or 4800).
The primary trend is upward, with overhead resistance at 5400 and heavy resistance likely at 6000 to 6800.
Japan
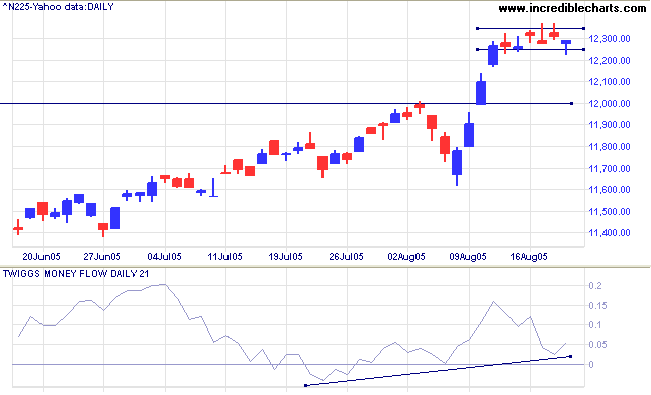
The Nikkei 225 consolidated between 12250 and 12350 over the last week, after a strong upward breakout above resistance at 12000. The most likely outcome is a close above 12350, signaling continuation of the primary trend, while a close below 12250 would indicate that support at 12000 is going to be tested. A retracement that respects 12000, or a false break below the new support level, would still be a bull signal.
Twiggs Money Flow (21-day) signals accumulation, with troughs above the zero line.
The long-term target for the breakout is 16400: 12000 + ( 12000 - 7600 <the April 2003 low>).
ASX Australia
The All Ordinaries consolidated with a narrow range and lower volume on Monday [1], signaling fading interest from buyers and sellers. Tuesday's breakout made reasonable gains on lower volume but Wednesday [3] shows resistance with a red candle and strong volume. The correction faded towards the end of Thursday with a weaker close and declining volume. Friday [5] promises another rally with a blue candle closing at the previous day's high; confirmed if there is a rise above 4450. A short retracement of two/three days would signal strong bullish interest in the intermediate up-trend.
The All Ordinaries consolidated with a narrow range and lower volume on Monday [1], signaling fading interest from buyers and sellers. Tuesday's breakout made reasonable gains on lower volume but Wednesday [3] shows resistance with a red candle and strong volume. The correction faded towards the end of Thursday with a weaker close and declining volume. Friday [5] promises another rally with a blue candle closing at the previous day's high; confirmed if there is a rise above 4450. A short retracement of two/three days would signal strong bullish interest in the intermediate up-trend.
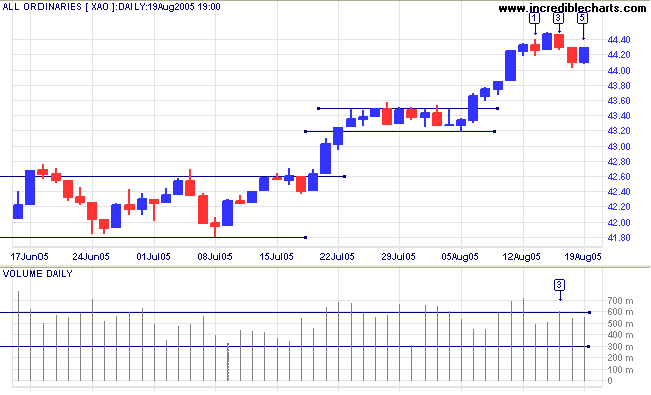
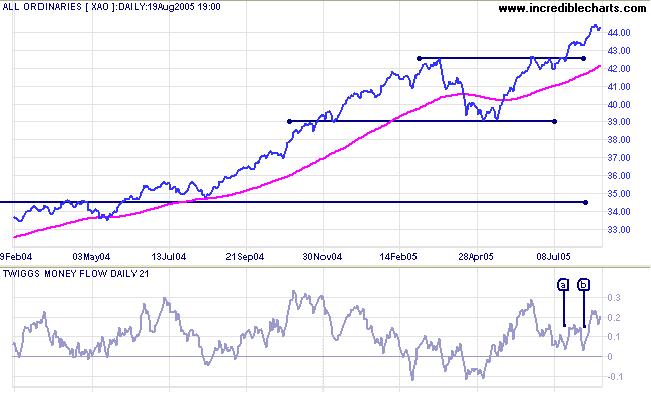
The index is in a primary up-trend.
Twiggs Money Flow (21-day) signals strong accumulation, after
completing a double-bottom at [a] and [b] above the zero line.
The target for the present rally is 4600: 4250 + (4250 -
3900).
Current weakness on the S&P 500 has a major influence over the behavior of the All Ords and could weigh down the local index.
Current weakness on the S&P 500 has a major influence over the behavior of the All Ords and could weigh down the local index.
For further assistance, read About
the Trading Diary.
Colin Twiggs
To fulfill a dream, to be allowed to sweat over lonely
labor,
to be given the chance to create, is the meat and potatoes of life.
The money is the gravy. As everyone else, I love to dunk my crust in it.
But alone, it is not a diet designed to keep body and soul together.
~ Bette Davis: The Lonely Life (1962)
to be given the chance to create, is the meat and potatoes of life.
The money is the gravy. As everyone else, I love to dunk my crust in it.
But alone, it is not a diet designed to keep body and soul together.
~ Bette Davis: The Lonely Life (1962)
Back Issues
Access the Trading Diary Archives.

Author: Colin Twiggs is a former investment banker with almost 40 years of experience in financial markets. He co-founded Incredible Charts and writes the popular Trading Diary and Patient Investor newsletters.
Using a top-down approach, Colin identifies key macro trends in the global economy before evaluating selected opportunities using a combination of fundamental and technical analysis.
Focusing on interest rates and financial market liquidity as primary drivers of the economic cycle, he warned of the 2008/2009 and 2020 bear markets well ahead of actual events.
He founded PVT Capital (AFSL No. 546090) in May 2023, which offers investment strategy and advice to wholesale clients.