Trading Diary
August 13, 2005
These extracts from my daily trading diary are
for educational purposes and should not be interpreted as
investment advice. Full terms and conditions can be found at
Terms
of Use.
USA
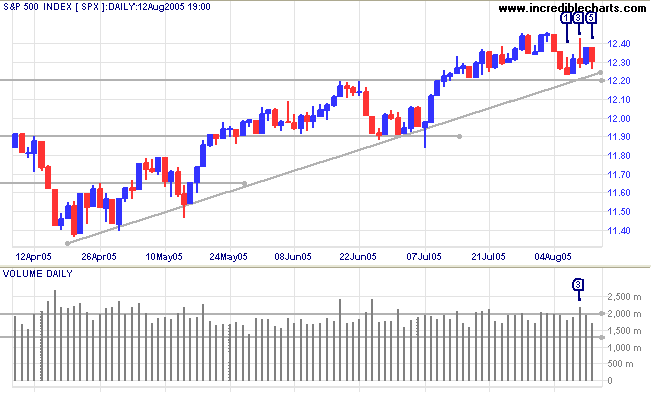
The S&P 500 successfully tested support at 1220 but now appears to be consolidating, with a tall shadow and big volume signaling resistance at [3]; and a tail at [5] indicating support.
If support at 1220 holds then we can expect a rally with a target of 1300: 1220 + (1220 - 1140). Failure would mean a retracement, facing secondary support at 1190 and primary support at 1140 (the marginal high above 1220 would also be a bearish sign for the primary trend).
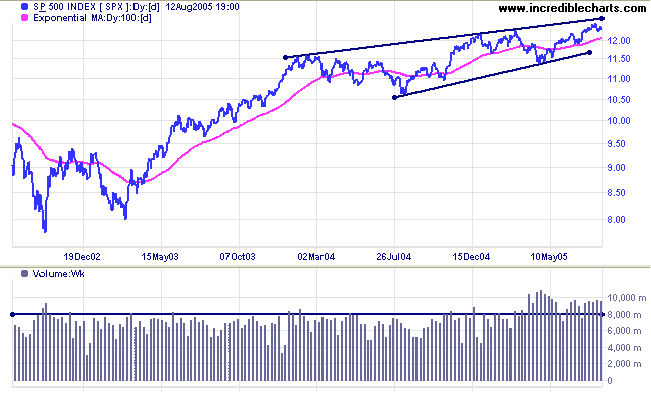
In the big picture, the primary trend is up. Unusually high
(weekly) volumes, and
Twiggs Money Flow (21-day) holding above the zero line,
indicate that the big money is buying into weakness. Historically
low volatility (63-day volatility is below 2%) warns of a strong
move ahead. The only incongruity is the bearish
rising wedge pattern over the last 18 months. An upside
breakout would negate the pattern; so a rise above 1260 would
have strong bullish implications.
Primary support is at 1150; resistance at 1260, the upper border of the wedge pattern.
Primary support is at 1150; resistance at 1260, the upper border of the wedge pattern.
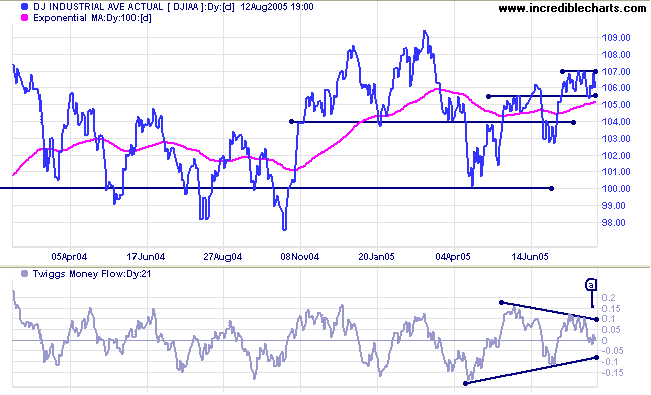
The Dow Industrial Average has consolidated between 10700
and 10550 over the past few weeks. This is a continuation
pattern; so an upside breakout is more likely, with a test of
primary resistance at 10900.
Twiggs Money Flow (21-day) respecting the zero line at [a]
would confirm this. Failure of support, on the other hand, would
lead to a test of intermediate support at 10250, and possibly
primary support at 10000.
In the longer term, Twiggs Money Flow (21-day) has sat astride the zero line, while the index ranged between 10000 and 11000. Volatility is low but there is no heavy (weekly) volume as evident on the S&P 500. Expect strong resistance overhead at 11000 to 11500. The most likely scenario is the Dow ranging for some time; which may restrain advances on the S&P 500 and NASDAQ indices.
In the longer term, Twiggs Money Flow (21-day) has sat astride the zero line, while the index ranged between 10000 and 11000. Volatility is low but there is no heavy (weekly) volume as evident on the S&P 500. Expect strong resistance overhead at 11000 to 11500. The most likely scenario is the Dow ranging for some time; which may restrain advances on the S&P 500 and NASDAQ indices.
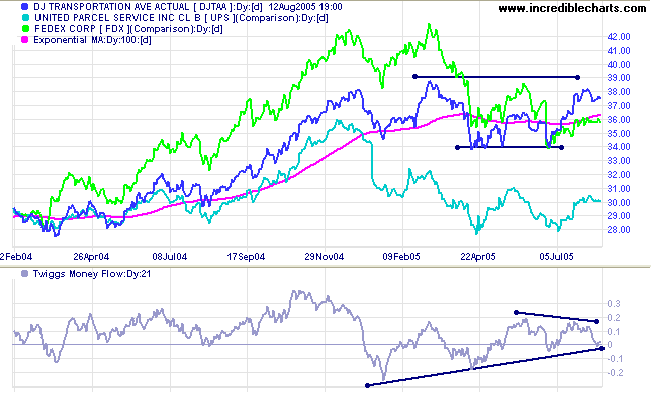
The Dow Jones Transportation Average is in a primary
up-trend, but consolidating below resistance at 3900. An upside
breakout would be a bullish sign for equity markets. Neither UPS
nor Fedex are in a primary up-trend; so it may take some time.
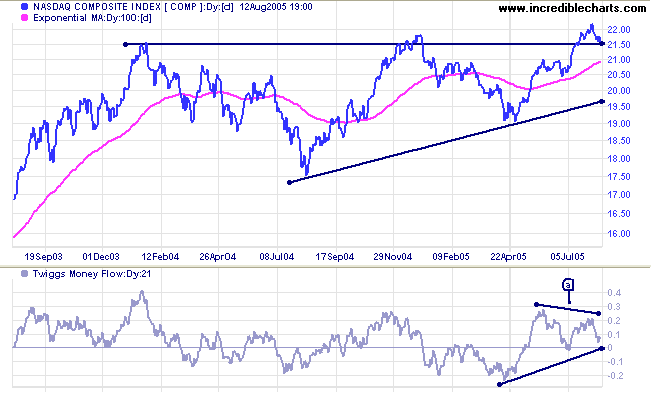
The Nasdaq Composite retreated to test the first line of
support at 2150 (from the January high).
Twiggs Money Flow (21-day) displays a short-term bearish
divergence, plus a stronger bullish divergence that respected
the zero line at [a]. Watch for a bull signal if the indicator
again respects zero and the average holds above 2150. Failure of
support would most likely test the lower border of the bearish
rising wedge pattern.
A rise above 2200 would be bullish, following the S&P 500 into a primary up-trend.
A rise above 2200 would be bullish, following the S&P 500 into a primary up-trend.
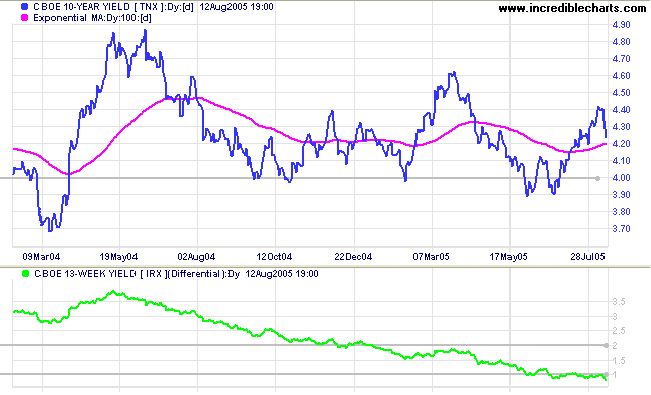
Treasury yields
Short-term yields rose as the Fed hiked the funds rate to 3.5%, but long-bond yields fell sharply on hints that the string of rate hikes may be nearing an end. The yield differential (10-year T-notes minus 13-week T-bills) fell below 1%, further squeezing bank margins. A flat yield curve is detrimental to the profitability of banks, who pay mostly short-term rates to depositors while charging long-term rates to borrowers.
Short-term yields rose as the Fed hiked the funds rate to 3.5%, but long-bond yields fell sharply on hints that the string of rate hikes may be nearing an end. The yield differential (10-year T-notes minus 13-week T-bills) fell below 1%, further squeezing bank margins. A flat yield curve is detrimental to the profitability of banks, who pay mostly short-term rates to depositors while charging long-term rates to borrowers.
Gold
New York: Spot gold broke out from a large symmetrical triangle, closing Friday at $445.50. The target for the breakout is $484: 440 + (454 - 410); though you should expect resistance at $450 to $454.
New York: Spot gold broke out from a large symmetrical triangle, closing Friday at $445.50. The target for the breakout is $484: 440 + (454 - 410); though you should expect resistance at $450 to $454.
United Kingdom
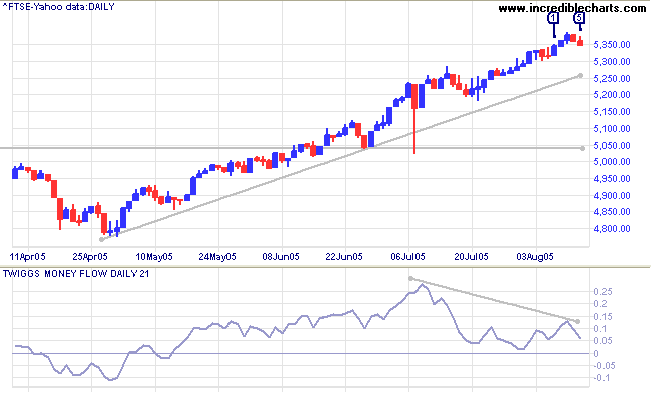
The FTSE 100 continues to wedge up cautiously, in a narrow band, while volume declines. The bearish divergence on Twiggs Money Flow (21-day) has weakened, with the indicator failing to cross below zero to signal distribution. If the indicator continues to hold above the zero line, expect further gains.
The primary trend is upward, while intermediate support is at 5200; with primary support at 5040 and 4800. Expect some overhead resistance at 5400, with heavy resistance at 6000 to 6800.
Japan
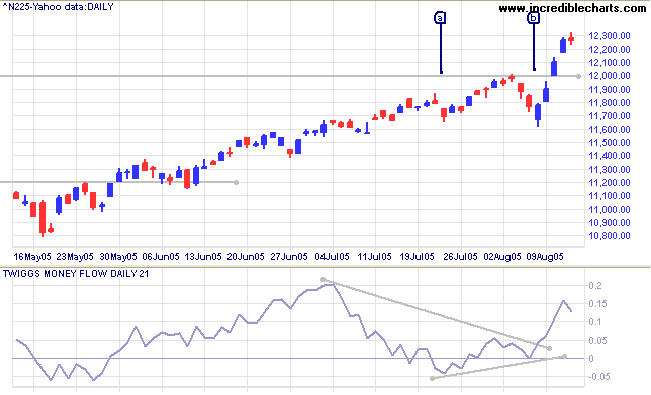
The Nikkei 225 broke through resistance at 12000, making a new 3-year high, after completing a double bottom at [a] and [b]. Twiggs Money Flow (21-day) confirmed the breakout, switching to a bullish divergence at [b], with a trough above the signal line.
A pull-back that respects the new support level, or a false break below 12000, would strengthen the bull signal.
ASX Australia
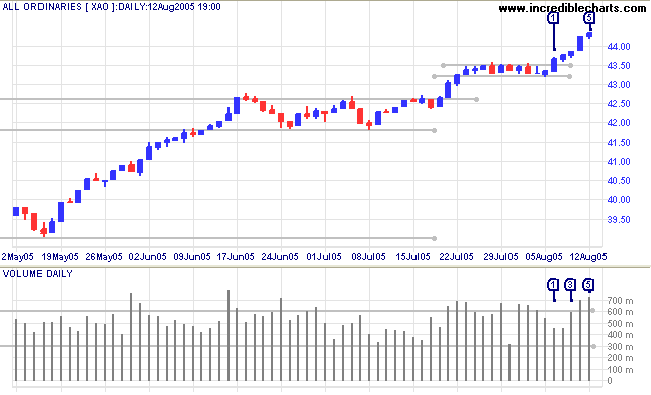
The All Ordinaries broke out from a narrow consolidation on Monday [1] on low volume. Wednesday [3] shows a compressed spring: narrow range and strong volume, warning of a strong move. Thursday delivered with a strong blue candle; big volume possibly warning of a short-term blow-off. Another compressed spring and even larger volume on Friday warns of another strong move; although this time there is more chance of a short-term retracement.
The All Ordinaries broke out from a narrow consolidation on Monday [1] on low volume. Wednesday [3] shows a compressed spring: narrow range and strong volume, warning of a strong move. Thursday delivered with a strong blue candle; big volume possibly warning of a short-term blow-off. Another compressed spring and even larger volume on Friday warns of another strong move; although this time there is more chance of a short-term retracement.
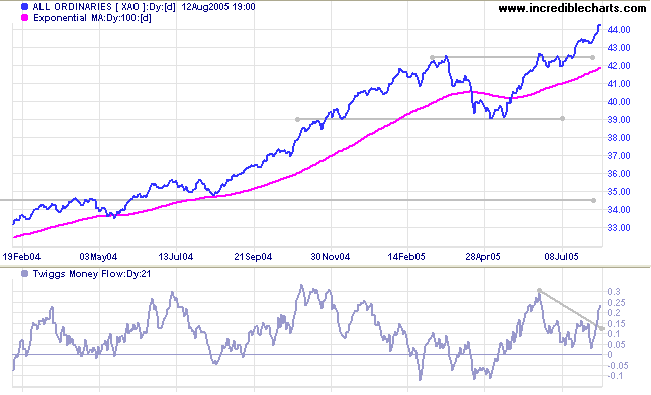
The index is in a primary up-trend.
Twiggs Money Flow (21-day) now signals accumulation after
completing a double-bottom above the zero line. The target for
the present rally is 4600: 4250 + (4250 - 3900).
The S&P 500 has a major influence over the behavior of the All Ords and should be watched closely.
The S&P 500 has a major influence over the behavior of the All Ords and should be watched closely.
For further assistance, read About
the Trading Diary.
Colin Twiggs
I was to learn later in life that we tend to meet any new
situation by reorganizing;
and a wonderful method it can be for creating the illusion of progress
while producing confusion, inefficiency, and demoralization.
~ Gaius Petronius Arbiter
and a wonderful method it can be for creating the illusion of progress
while producing confusion, inefficiency, and demoralization.
~ Gaius Petronius Arbiter
Back Issues
Access the Trading Diary Archives.

Author: Colin Twiggs is a former investment banker with almost 40 years of experience in financial markets. He co-founded Incredible Charts and writes the popular Trading Diary and Patient Investor newsletters.
Using a top-down approach, Colin identifies key macro trends in the global economy before evaluating selected opportunities using a combination of fundamental and technical analysis.
Focusing on interest rates and financial market liquidity as primary drivers of the economic cycle, he warned of the 2008/2009 and 2020 bear markets well ahead of actual events.
He founded PVT Capital (AFSL No. 546090) in May 2023, which offers investment strategy and advice to wholesale clients.