Trading Diary
August 6, 2005
These extracts from my daily trading diary are
for educational purposes and should not be interpreted as
investment advice. Full terms and conditions can be found at
Terms
of Use.
USA
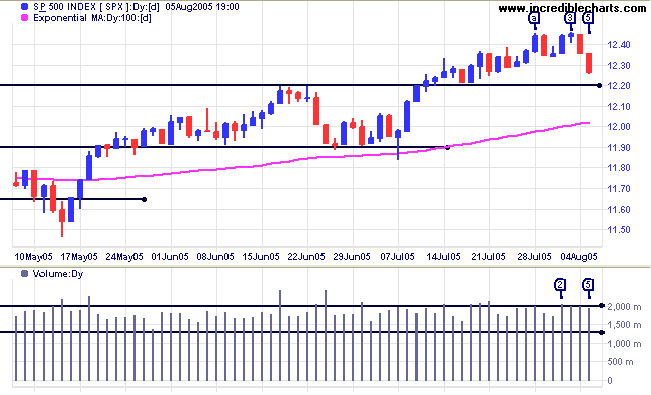
The S&P 500 completed a small double top, with highs at [a] and [3], and is headed for a test of intermediate support at 1220. Strong volumes on the latest downswing indicate that initial support may fail. There is a further support level at 1190; a close below there would signal a test of primary support at 1140.
The S&P 500 completed a small double top, with highs at [a] and [3], and is headed for a test of intermediate support at 1220. Strong volumes on the latest downswing indicate that initial support may fail. There is a further support level at 1190; a close below there would signal a test of primary support at 1140.
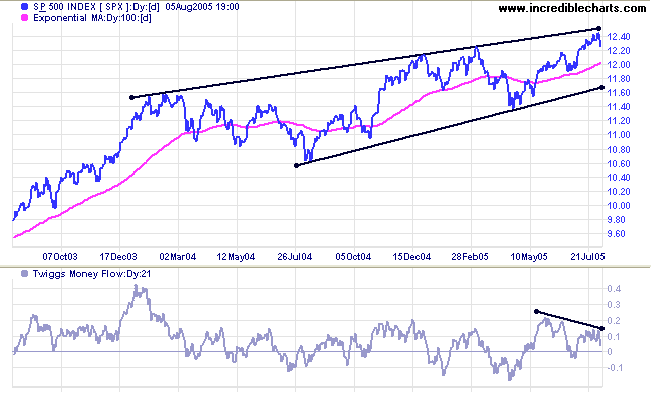
The primary trend is upwards but there are strong bearish signs:
a bearish
rising wedge pattern over the last 18 months; and a bearish
divergence on
Twiggs Money Flow (21-day) warns of distribution.
Primary support is at 1150. Resistance is at 1250: the upper border of the wedge pattern.
Volatility remains at historically low levels, with 63-day Volatility below 2%. Low volatility (often signaled by a narrowing of Bollinger Bands) often precedes a strong move. The challenge is to determine in what direction.
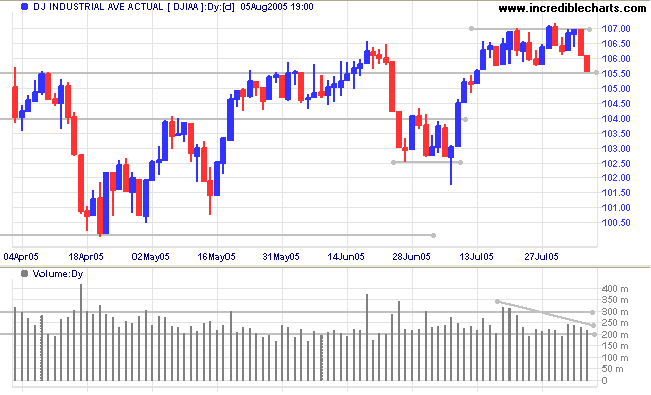
The Dow Industrial Average is testing support at the lower
border of the last few weeks' consolidation. Intermediate support
is at 10250; with primary support at 10000. Failure of the
primary support level, while unlikely at present, would be a
strong bear signal for the entire market.
In the longer term, the index is ranging between 10000 and 11000. Expect heavy resistance overhead, at 11000 to 11500. The most likely scenario is that the Dow will continue to range for some time, which may restrain advances on the S&P 500 and NASDAQ indices.
In the longer term, the index is ranging between 10000 and 11000. Expect heavy resistance overhead, at 11000 to 11500. The most likely scenario is that the Dow will continue to range for some time, which may restrain advances on the S&P 500 and NASDAQ indices.
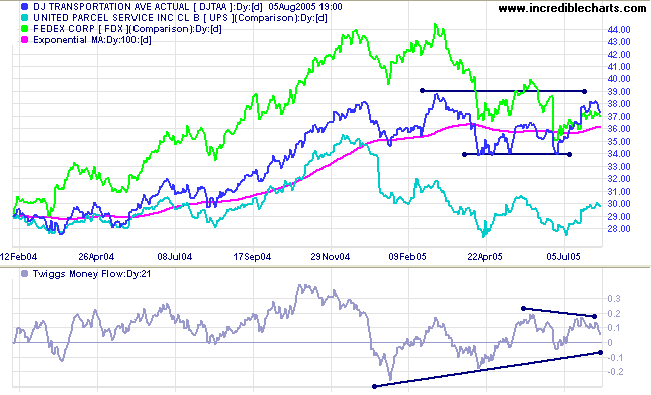
The Dow Jones Transportation Average is in a primary
up-trend but has to overcome resistance at 3900.
Twiggs Money Flow (21-day) shows a short-term bearish
divergence on top of the longer-term bullish series of higher
lows: signaling that the index faces consolidation or
reversal.
UPS is consolidating after equal lows, while Fedex remains in a down-trend.
UPS is consolidating after equal lows, while Fedex remains in a down-trend.
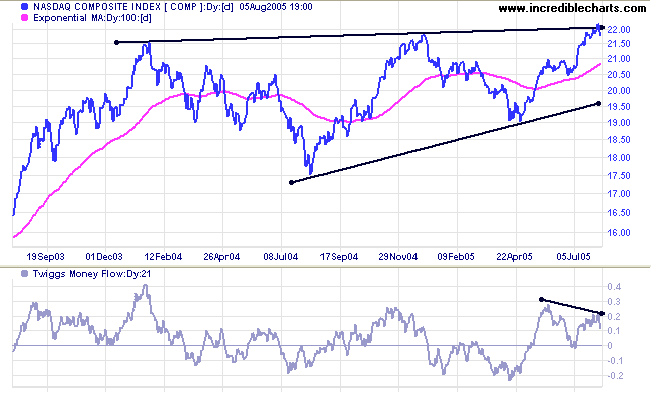
The Nasdaq Composite retreated below 2200 and appears set
to confirm that the index is in a bearish, long-term
rising wedge; not a bullish
ascending triangle as previously indicated.
Twiggs Money Flow (21-day) is also bearish after the recent
divergence.
A breakout below 2050 would be a bear signal, while a rise above 2200 would be bullish, following the S&P 500 into a primary up-trend.
A breakout below 2050 would be a bear signal, while a rise above 2200 would be bullish, following the S&P 500 into a primary up-trend.
Treasury yields
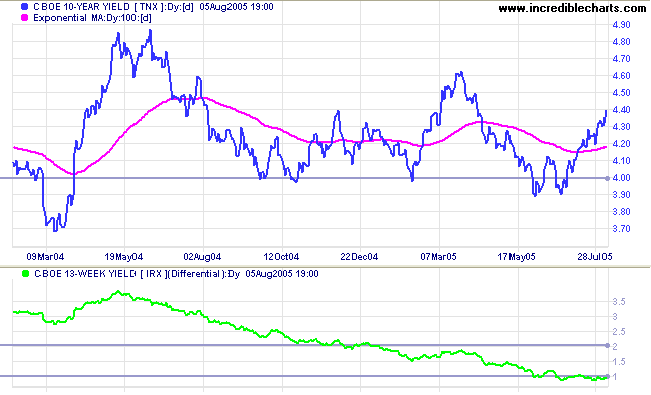
The yields on 13-week T-bills and 10-year Treasury notes continue to climb. Strong payroll numbers warn of increased inflationary pressure, signaling that the Fed is unlikely to slow its regular rate hikes; while applying upward pressure to long bond yields.
The yield differential (10-year T-notes minus 13-week T-bills) is consolidating at 1%. Below 1% is a long-term negative for equity markets, while above 2% is a healthy spread. A flat yield curve is especially significant for profitability of banking sector; who pay mostly short-term rates to depositors while charging long-term rates to borrowers.
Gold
New York: Spot gold tested resistance at $440, before closing at $436.60 on Friday. A breakout above $440 would complete the large symmetrical triangle with a target of $484: 440 + (454 - 410).
New York: Spot gold tested resistance at $440, before closing at $436.60 on Friday. A breakout above $440 would complete the large symmetrical triangle with a target of $484: 440 + (454 - 410).
United Kingdom
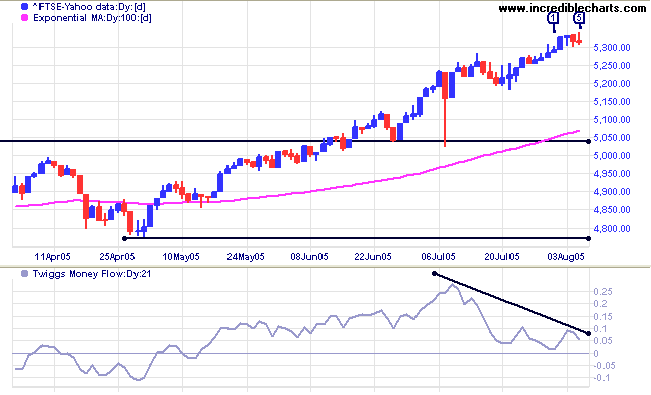
The FTSE 100 is wedging up cautiously, in a narrow band, while volume declines. A strong bearish divergence on Twiggs Money Flow (21-day) warns that distribution is taking place; evident from the number of weak closes in the past two weeks. Intermediate support is at 5200; with primary support at 5040 and 4800.
The FTSE 100 is wedging up cautiously, in a narrow band, while volume declines. A strong bearish divergence on Twiggs Money Flow (21-day) warns that distribution is taking place; evident from the number of weak closes in the past two weeks. Intermediate support is at 5200; with primary support at 5040 and 4800.
Japan
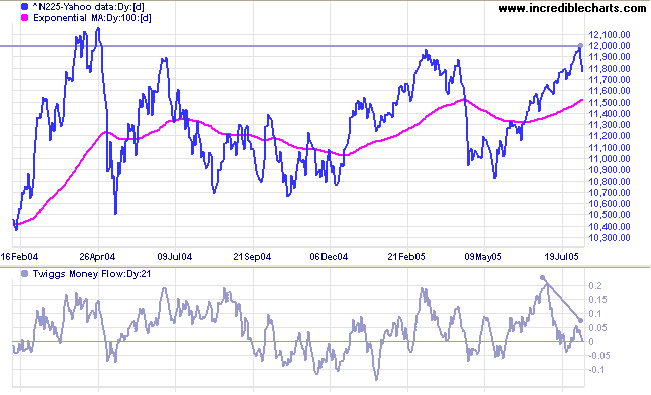
The Nikkei 225 tested resistance at 12000. The bearish divergence on Twiggs Money Flow (21-day) warns that the present test is likely to fail.
A breakout above 12000, when followed by a pull-back that respects the new support level, would be a strong bull signal. While not as strong, a pull-back below 12000, that respects the long-term (100-day) MA would also be bullish.
ASX Australia
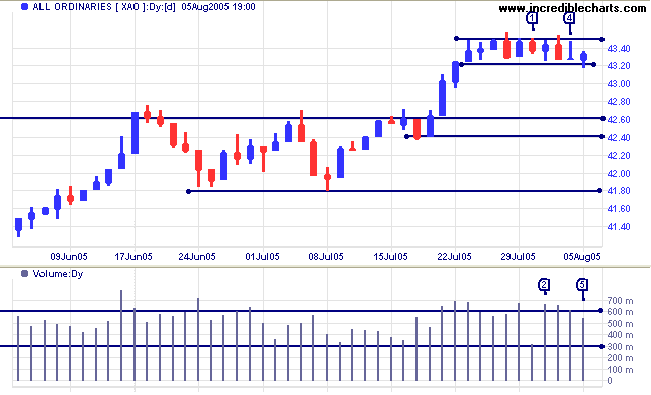
The All Ordinaries continues to consolidate between 4320 and resistance at 4350. Low volume on the red candle at [1] signals a lack of selling pressure, while strong volume and a long tail at [2] indicate buying support. The red candle and strong volume at [3] signals the resumption of selling pressure, while [4] shows early buying support overcome by late selling. Lower volume and a stronger close on Friday [5] indicate fading interest from sellers and buyers rallying.
The narrow rectangle is a continuation pattern, signaling an upward breakout.
Intermediate support is at 4260/4240, with further backup at 4180.
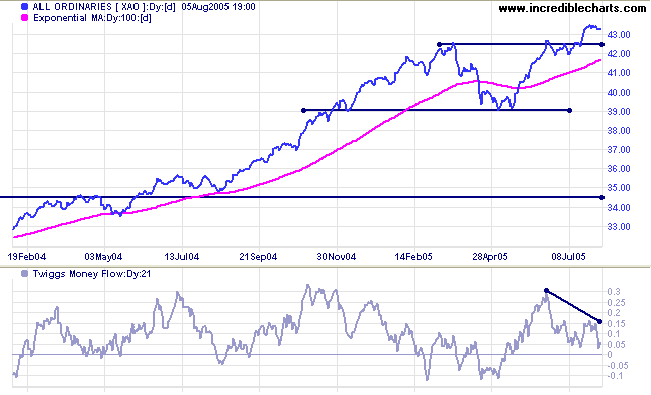
The index is in a primary up-trend. However, a bearish
divergence on
Twiggs Money Flow (21-day) continues to warn of potential
weakness. The target for the present rally is 4600: 4250 + (4250
- 3900).
The S&P 500 has a major influence over the behavior of the All Ords and should be watched closely. Proceed with caution: there are many bears in the woods.
The S&P 500 has a major influence over the behavior of the All Ords and should be watched closely. Proceed with caution: there are many bears in the woods.
For further assistance, read About
the Trading Diary.
Colin Twiggs
|
Again and again I admonish my students
both in America and Europe: 'Don't aim at success--the more
you aim at it and make it a target, the more you are going
to miss it. For success, like happiness, cannot be pursued; it must ensue, and it only does so as the unintended side-effect of one's personal dedication to a cause greater than oneself or as the by-product of one's surrender to a person other than oneself. Happiness must happen, and the same holds for success: you have to let it happen by not caring about it. I want you to listen to what your conscience commands you to do and go on to carry it out to the best of your knowledge. Then you will live to see that in the long run -- in the long run, I say -- success will follow you precisely because you had forgotten to think of it. ~ Victor Frankl: Man's Search for Meaning |
Back Issues
Access the Trading Diary Archives.

Author: Colin Twiggs is a former investment banker with almost 40 years of experience in financial markets. He co-founded Incredible Charts and writes the popular Trading Diary and Patient Investor newsletters.
Using a top-down approach, Colin identifies key macro trends in the global economy before evaluating selected opportunities using a combination of fundamental and technical analysis.
Focusing on interest rates and financial market liquidity as primary drivers of the economic cycle, he warned of the 2008/2009 and 2020 bear markets well ahead of actual events.
He founded PVT Capital (AFSL No. 546090) in May 2023, which offers investment strategy and advice to wholesale clients.