Trading Diary
July 30, 2005
These extracts from my daily trading diary are
for educational purposes and should not be interpreted as
investment advice. Full terms and conditions can be found at
Terms
of Use.
USA
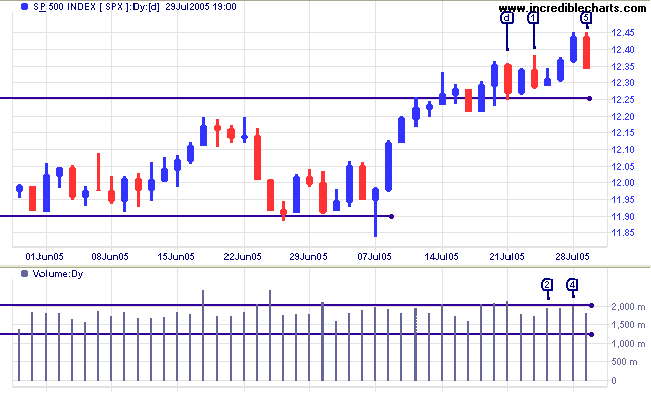
The week started slowly for the S&P 500, with a false break [1] above the short-term high from last week, followed by a weak close and increased volume signaling strong selling on day [2]. Selling pressure abated, resulting in a new high after solid blue candles with good volume on days [3] and [4]. An early retracement on day [5] signals continued uncertainty. Expect a test of support at 1225/1220.
Failure of support would be an (intermediate) bear signal.
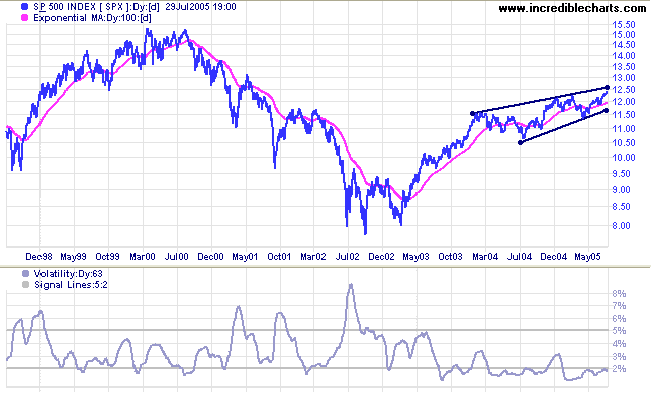
The primary trend is upwards and
Twiggs Money Flow (100-day) signals accumulation. Primary
support is at 1150. Resistance is at 1250: the upper border of
the
rising wedge pattern.
Volatility is at historically low levels, with 63-day Volatility stalling below 2%, confirming that the market is consolidating. Consolidations are normally followed by strong trend moves; the challenge is to determine when the consolidation ends and the trend begins.
Volatility is at historically low levels, with 63-day Volatility stalling below 2%, confirming that the market is consolidating. Consolidations are normally followed by strong trend moves; the challenge is to determine when the consolidation ends and the trend begins.
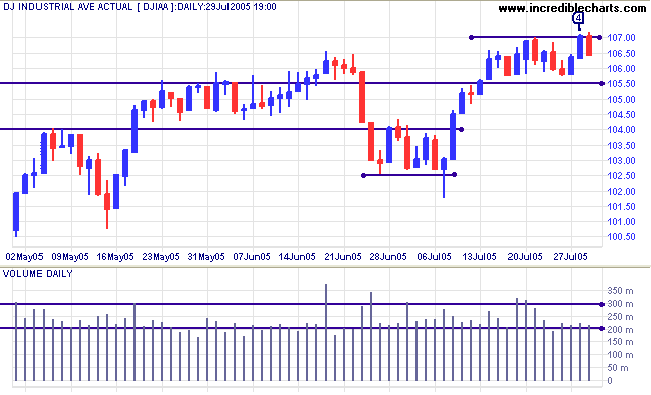
The Dow Industrial Average is lagging behind the S&P
500 and has consolidated over the last two weeks in a narrow
range between 10550 and 10700. Low volumes experienced this week
are typical of consolidations.
In the longer term, the index is ranging between 10000 and 11000. A recent higher low on Twiggs Money Flow (100-day) is a positive sign but expect heavy overhead resistance between 11000 and 11500. Primary support is at 10000 and the most likely scenario is that the Dow continues to range for some time, which may restrain the S&P 500 and NASDAQ indices.
Failure of the 10000 support level, while unlikely at present, would be a strong bear signal for the entire market.
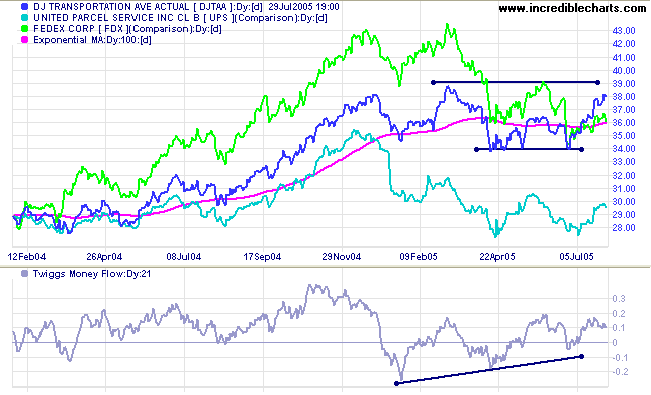
Having completed a
double bottom, the Dow Jones Transportation Average is
in a primary up-trend and appears headed for a test of resistance
at 3900, the target from the recent
double bottom: 3650 + (3650 - 3400).
Twiggs Money Flow (21-day) is bullish with successive higher lows.
UPS has consolidated after equal lows; while Fedex remains in a down-trend.
Twiggs Money Flow (21-day) is bullish with successive higher lows.
UPS has consolidated after equal lows; while Fedex remains in a down-trend.
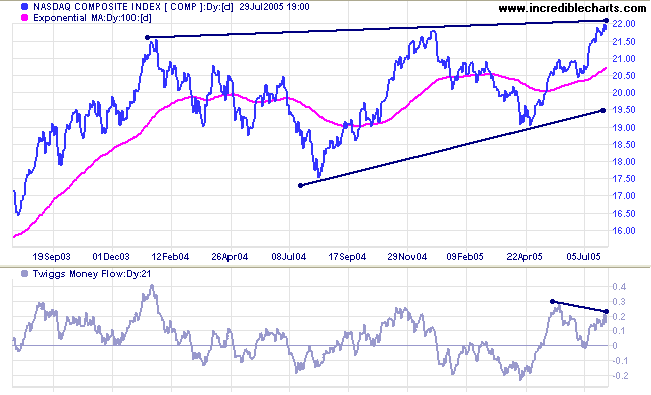
The Nasdaq Composite completed a marginal new high but has
turned back below 2200.
Twiggs Money Flow (21-day) has formed a bearish
divergence. A breakout above 2200 would be bullish, following
the S&P 500 into a primary up-trend, while a down-turn would
confirm that the index is in a bearish
rising wedge, and not an
ascending triangle, with long-term implications.
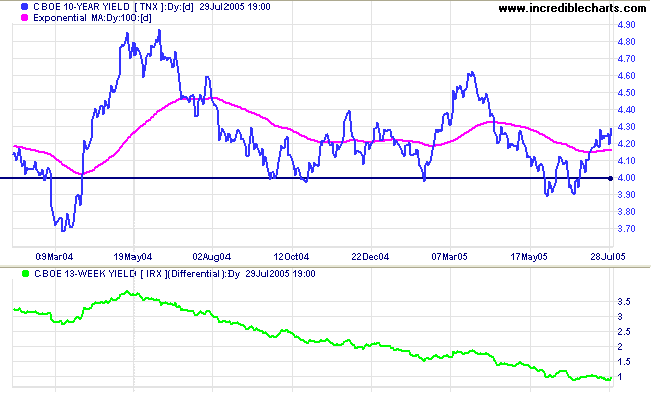
Treasury yields
The yield on 10-year treasury notes continues to climb in sync with 13-week T-bills, while the yield differential (10-year T-notes minus 13-week T-bills) remains at 1%.
Be aware that China's revaluation may have a negative effect on US bond yields. By shifting to a trade-weighted basket of currencies, China will need to diversify its holdings of US dollars into other currencies. This may drive up bond yields and drive down the US dollar. Higher long-term rates would cool the over-heated property market, while a lower dollar would boost exports; so the impact on equity markets is uncertain.
Gold
New York: Spot gold rallied to close at $429.50 on Friday and may be headed for a test of resistance at $440. The large symmetrical triangle continues: a breakout above $440 would be a strong bull signal.
New York: Spot gold rallied to close at $429.50 on Friday and may be headed for a test of resistance at $440. The large symmetrical triangle continues: a breakout above $440 would be a strong bull signal.
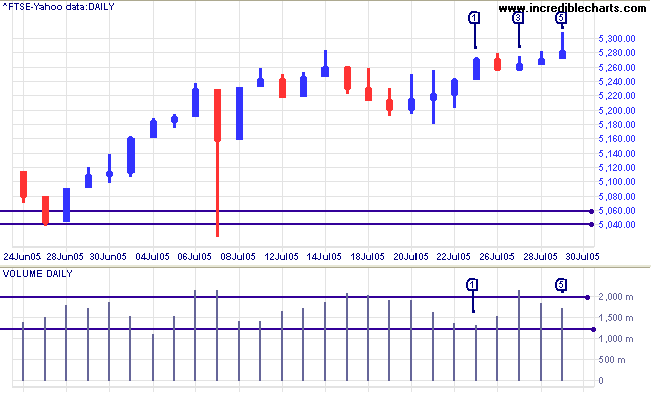
United Kingdom
The FTSE 100 started the week with low volume [1], signaling a lack of enthusiasm from buyers. The index then encountered resistance at 5280/5300, with strong volume at [3] and weak closes through the rest of the week. A close above 5300 would signal that resistance has failed and another upward surge is to be expected. A close below the low of [1] would signal a test of support at 5180 and possibly 5040.
The FTSE 100 started the week with low volume [1], signaling a lack of enthusiasm from buyers. The index then encountered resistance at 5280/5300, with strong volume at [3] and weak closes through the rest of the week. A close above 5300 would signal that resistance has failed and another upward surge is to be expected. A close below the low of [1] would signal a test of support at 5180 and possibly 5040.
Japan
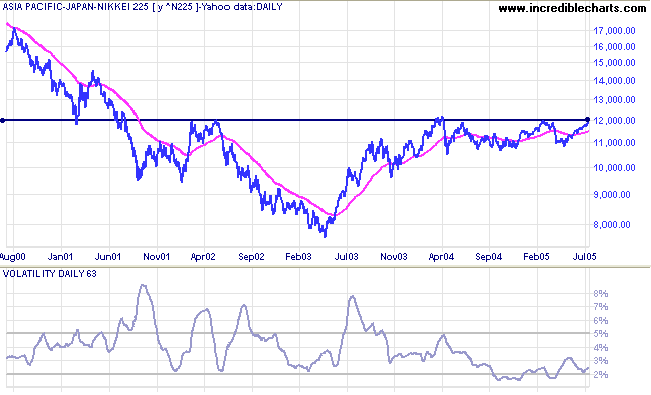
The Nikkei 225 displays a bullish consolidation in a narrow band below resistance at 12000. Expect a strong rally if there is a breakout above 12000. A pull-back that respects the long-term (100-day) MA would be a further bull signal.
The Nikkei 225 displays a bullish consolidation in a narrow band below resistance at 12000. Expect a strong rally if there is a breakout above 12000. A pull-back that respects the long-term (100-day) MA would be a further bull signal.
ASX Australia
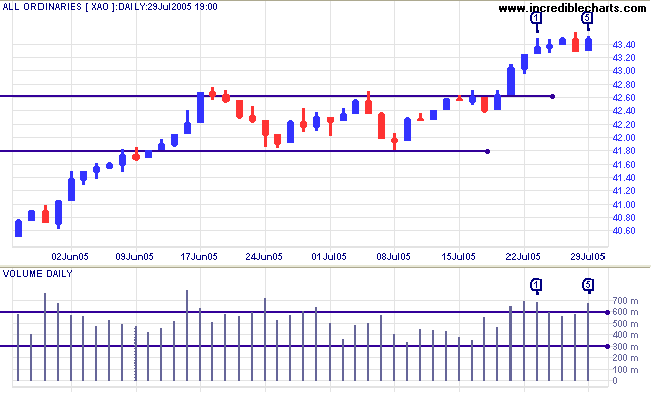
The All Ordinaries has consolidated below resistance at 4350 over the last week. The narrow rectangle is a continuation signal and high volume at [5] may precede an upward breakout.
Intermediate support is at 4260/4250.
The All Ordinaries has consolidated below resistance at 4350 over the last week. The narrow rectangle is a continuation signal and high volume at [5] may precede an upward breakout.
Intermediate support is at 4260/4250.
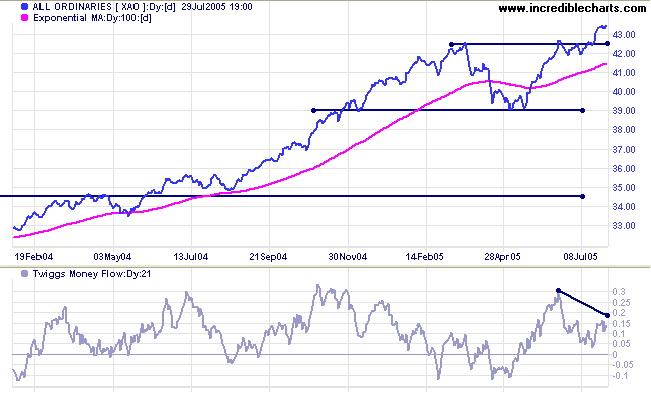
The index is in a primary up-trend. However,
Twiggs Money Flow (21-day) shows a bearish
divergence; so we need to be cautious. Failure of
support at 4250 would be a bearish sign.
The S&P 500 has a major influence over the behavior of the All Ords and should be watched closely in the week ahead.
The S&P 500 has a major influence over the behavior of the All Ords and should be watched closely in the week ahead.
For further assistance, read About
the Trading Diary.
Colin Twiggs
All over the place, from the popular culture to the propaganda
system,
there is constant pressure to make people feel that they are helpless,
that the only role they can have is to ratify decisions and to consume.
- Noam Chomsky
there is constant pressure to make people feel that they are helpless,
that the only role they can have is to ratify decisions and to consume.
- Noam Chomsky
Back Issues
Access the Trading Diary Archives.

Author: Colin Twiggs is a former investment banker with almost 40 years of experience in financial markets. He co-founded Incredible Charts and writes the popular Trading Diary and Patient Investor newsletters.
Using a top-down approach, Colin identifies key macro trends in the global economy before evaluating selected opportunities using a combination of fundamental and technical analysis.
Focusing on interest rates and financial market liquidity as primary drivers of the economic cycle, he warned of the 2008/2009 and 2020 bear markets well ahead of actual events.
He founded PVT Capital (AFSL No. 546090) in May 2023, which offers investment strategy and advice to wholesale clients.