Trading Diary
July 23, 2005
These extracts from my daily trading diary are
for educational purposes and should not be interpreted as
investment advice. Full terms and conditions can be found at
Terms
of Use.
USA
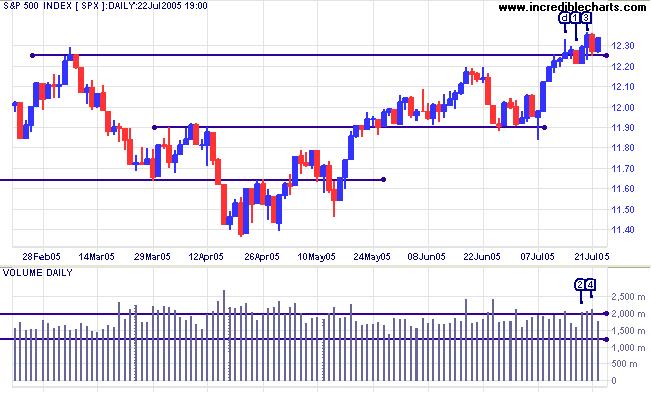
The S&P 500 confirmed last week's breakout with a rise above the high of [d]. The week started badly with a fall through support at [1]. The index closed at the low but on lower volume. Tuesday recovered on strong volume [2]; the 1-day retracement a strong bull signal. This was followed through on Wednesday, with a new 3-year high at [3]. Another retracement on Thursday, accompanied by strong volume [4], was again short-lived. Buying support emerged on Friday, albeit on lower volume.
The market is still a bit choppy and I would wait for a rise above the high of [3] to add further confirmation.
The primary trend is upwards and the higher low on
Twiggs Money Flow (100-day) signals accumulation, but until
there is a breakout above 1250, the upper border of the rising
wedge pattern, the market is likely to be hesitant. The
calculated target for the breakout is possibly optimistic at
1310: 1225 + (1225 - 1140).
Resistance is at 1250 and support at 1150.
Resistance is at 1250 and support at 1150.
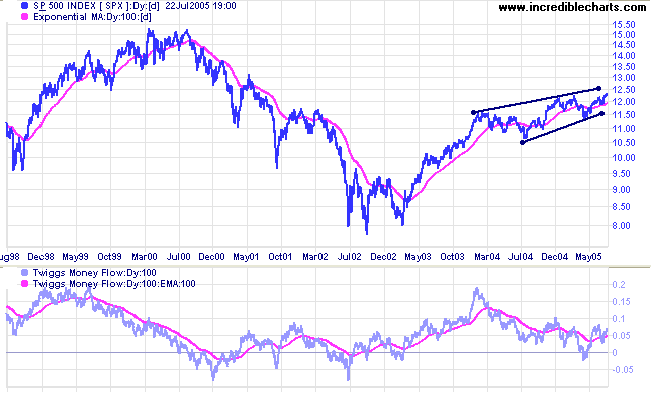
I have amended the signal line on Twiggs Money Flow from a 50-day
to 100-day exponential MA. It tends to give clearer signals.
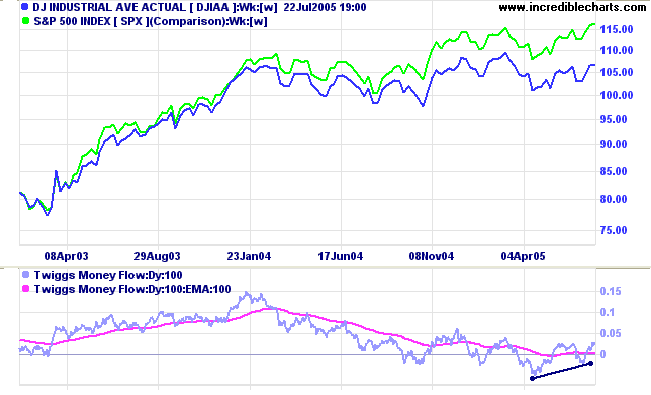
The Dow Industrial Average is lagging behind the S&P
500 and has so far failed to confirm the start of the primary
up-trend. The higher low on
Twiggs Money Flow (100-day) is a positive sign but expect
heavy overhead resistance between 11000 and 11500. Primary
support is at 10000 and the most likely scenario is that the Dow
continues to range between 10000 and 11000 for some time.
Failure of the 10000 support level, while unlikely at present, would be a strong bear signal for the entire market.
Failure of the 10000 support level, while unlikely at present, would be a strong bear signal for the entire market.
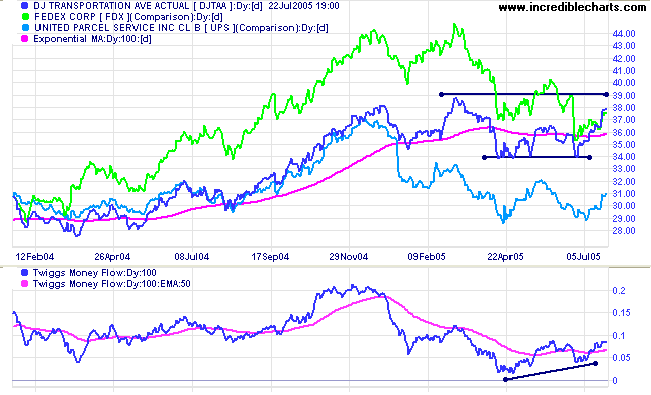
Having completed a
double bottom, the Dow Jones Transportation Average
has resumed a primary up-trend and appears headed for its target
of 3900: 3650 + (3650 - 3400).
UPS formed equal lows and may follow the Transport Average; while Fedex remains in a strong down-trend.
UPS formed equal lows and may follow the Transport Average; while Fedex remains in a strong down-trend.
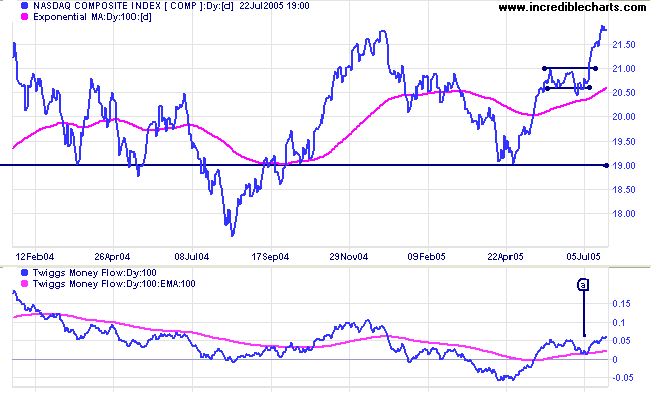
The Nasdaq Composite broke out above 2180, the December
2004 high, signaling the start of a primary up-trend. A higher
low in April was the first sign that the trend may reverse, which
has now been confirmed by the new high. This also marks the
breakout from an 18-month bullish
ascending triangle, with a target of 2550: 2150 + (2150 -
1750).
Twiggs Money Flow (100-day) shows a bullish trough above the signal line at [a].
Twiggs Money Flow (100-day) shows a bullish trough above the signal line at [a].
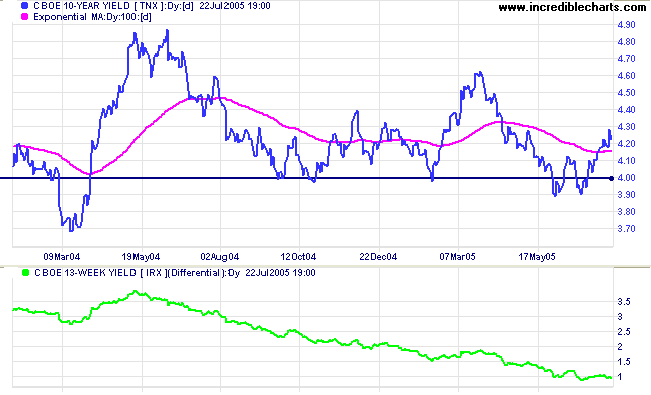
Treasury yields
The yield on 10-year treasury notes climbed strongly, in sync with 13-week T-bills, while the yield differential (10-year T-notes minus 13-week T-bills) remained at 1%.
Be aware that China's revaluation may have a negative effect on US bond yields. By shifting the RMB to a trade-weighted basket of currencies, China will need to diversify its holdings of US dollars into a broader basket of currencies. This may drive up bond yields and drive down the US dollar. Higher long-term rates would cool the over-heated property market, while the lower dollar would boost exports; so the impact on equity markets is uncertain.
Gold
New York: Spot gold rallied to close at $424.40 on Friday. Whether this is the start of another intermediate rally is too soon to tell.
The metal is above the lower border of a large symmetrical triangle and an upturn from here would be mildly bullish.
New York: Spot gold rallied to close at $424.40 on Friday. Whether this is the start of another intermediate rally is too soon to tell.
The metal is above the lower border of a large symmetrical triangle and an upturn from here would be mildly bullish.
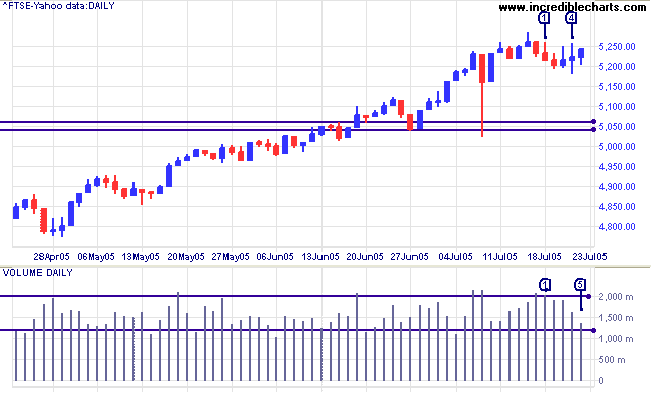
United Kingdom
The FTSE 100 started the week with a 3-day correction on strong volumes. Sellers faded towards the end of the week with the index consolidating on declining volume. A rise above the high of [4] would indicate that the primary move is likely to continue, while a fall below the low of [3] would signal that a test of support at 5040/5060 (the February highs) is likely.
The FTSE 100 started the week with a 3-day correction on strong volumes. Sellers faded towards the end of the week with the index consolidating on declining volume. A rise above the high of [4] would indicate that the primary move is likely to continue, while a fall below the low of [3] would signal that a test of support at 5040/5060 (the February highs) is likely.
ASX Australia
The All Ordinaries has broken through resistance at 4260/4275 after consolidating in a narrow band below that level. The correction at [2] only lasted one day, a strong sign that an upward breakout would follow. The breakout on Thursday was accompanied by strong volume; a bullish sign. Friday's narrower range on increased volume signals selling pressure, however.
The All Ordinaries has broken through resistance at 4260/4275 after consolidating in a narrow band below that level. The correction at [2] only lasted one day, a strong sign that an upward breakout would follow. The breakout on Thursday was accompanied by strong volume; a bullish sign. Friday's narrower range on increased volume signals selling pressure, however.
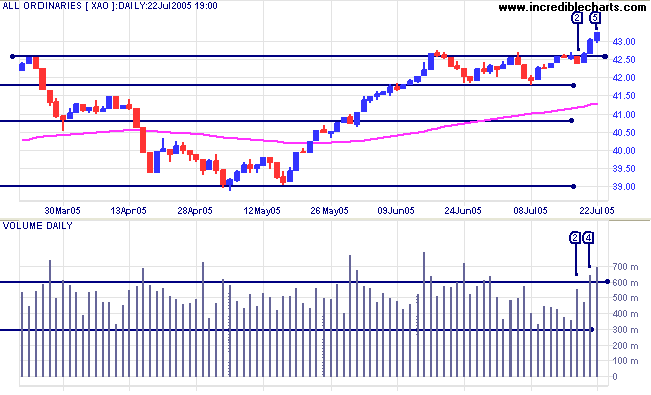
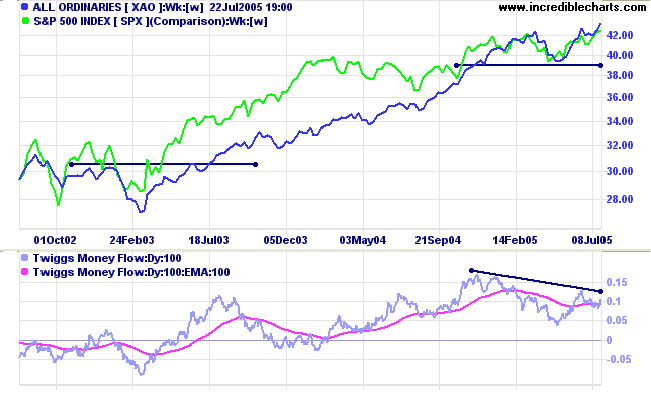
The index has commenced a primary up-trend. The calculated target
for the primary move is 4620: 4260 + (4260 - 3900). However,
Twiggs Money Flow (100-day) displays long- and
intermediate-term bearish divergences; so we need to adopt a
cautious approach until we have confirmation. Look for a
retracement that respects support at 4260.
Failure of support at 4260 level would be a bearish sign.
The S&P 500 has a major influence over the behavior of the All Ords; so watch this closely in the week ahead.
Failure of support at 4260 level would be a bearish sign.
The S&P 500 has a major influence over the behavior of the All Ords; so watch this closely in the week ahead.
For further assistance, read About
the Trading Diary.
Colin Twiggs
To build may have to be the slow and laborious task of
years.
To destroy can be the thoughtless act of a single day
- Winston Churchill
To destroy can be the thoughtless act of a single day
- Winston Churchill
Back Issues
Access the Trading Diary Archives.

Author: Colin Twiggs is a former investment banker with almost 40 years of experience in financial markets. He co-founded Incredible Charts and writes the popular Trading Diary and Patient Investor newsletters.
Using a top-down approach, Colin identifies key macro trends in the global economy before evaluating selected opportunities using a combination of fundamental and technical analysis.
Focusing on interest rates and financial market liquidity as primary drivers of the economic cycle, he warned of the 2008/2009 and 2020 bear markets well ahead of actual events.
He founded PVT Capital (AFSL No. 546090) in May 2023, which offers investment strategy and advice to wholesale clients.