Trading Diary
July 9, 2005
These extracts from my daily trading diary are for educational
purposes and should not be interpreted as investment advice. Full
terms and conditions can be found at Terms
of Use.
USA
The Dow Industrial Average completed a short-term triple bottom after a third test of support at 10250; earlier tests having taken place at [a] and [b]. The long tail and higher volume at [4] are a bullish sign, and Friday completed the triple bottom with a close above 10400. Expect a rally to test resistance at 10650.
The Dow Industrial Average completed a short-term triple bottom after a third test of support at 10250; earlier tests having taken place at [a] and [b]. The long tail and higher volume at [4] are a bullish sign, and Friday completed the triple bottom with a close above 10400. Expect a rally to test resistance at 10650.
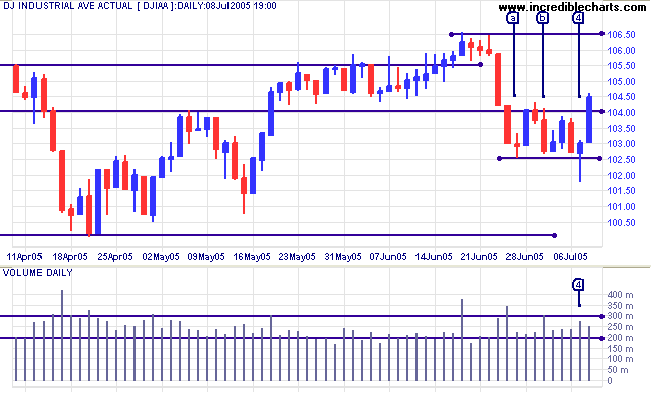
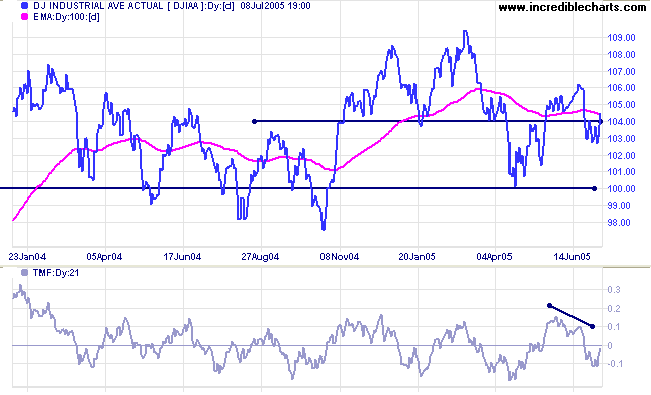
The bearish
divergence on
Twiggs Money Flow (21-day) indicates that resistance at 10650
is likely to hold, with a subsequent test of support at 10000. In
the longer term the indicator is oscillating around the zero line
(with fairly symmetrical peaks and troughs) and not showing much
direction.
A close below primary support at 10000 would trigger a strong primary down-trend; with confirmation from a pull-back that respects a new resistance level at 10000, or a fall below 9750, the October 2004 low.
Bullish developments on the S&P 500 or NASDAQ increase the possibility of an upside breakout, but we should not underestimate the strength of resistance at 11000. The most likely scenario is that the Dow continues to range between 10000 and 11000 for some time.
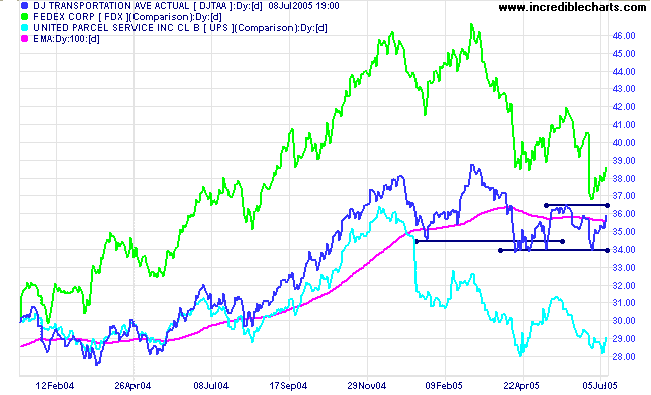
The Dow Jones Transportation Average continues to hold
above support at 3400. A rise above 3650 would indicate further
weakness in the primary trend. Failure to break resistance at
3650 would be a bearish sign. And a close below 3400 would be a
strong bear signal; especially as it follows a false break above
the May 1999 high.
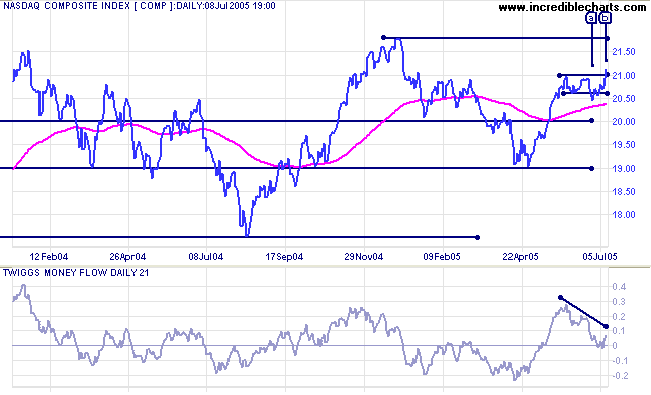
The Nasdaq Composite completed a false (marginal) break
[a] below support at 2060, followed by a bullish breakout [b]
above resistance at 2100; signaling a test of resistance at 2180.
A close above 2180 would break out from an 18-month bullish
ascending triangle, with a target of 2550: 2150 + (2150 -
1750).
The strong bearish divergence on Twiggs Money Flow (21-days) is at odds with the above; so exercise caution.
A fall below 1900 would be a long-term bear signal.
The strong bearish divergence on Twiggs Money Flow (21-days) is at odds with the above; so exercise caution.
A fall below 1900 would be a long-term bear signal.
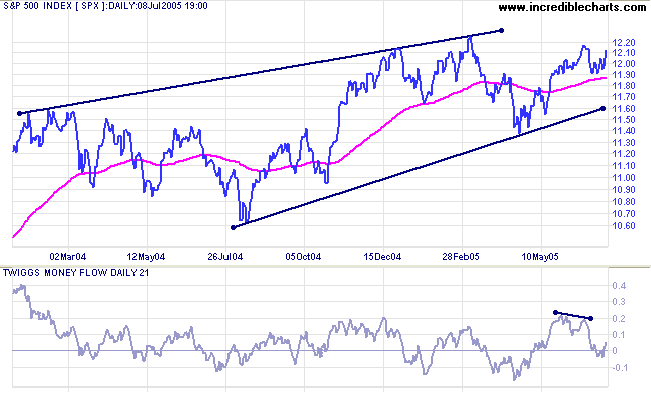
The S&P 500 appears more bullish than it has for some
time. After completing a small triple bottom, similar to the Dow,
the index is headed for a test of resistance at 1225. A break
through resistance would make a new 3-year high and signal
resumption of the primary up-trend.
There are two negatives: the (intermediate-term) bearish divergence on Twiggs Money Flow (21-day), signaling distribution, and the bearish rising wedge pattern formed over the last 18 months; so exercise caution.
There are two negatives: the (intermediate-term) bearish divergence on Twiggs Money Flow (21-day), signaling distribution, and the bearish rising wedge pattern formed over the last 18 months; so exercise caution.
Treasury yields
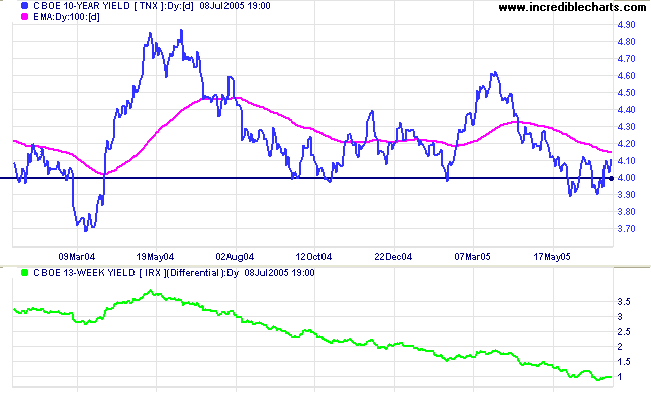
The yield on 10-year treasury notes is whipsawing around support at 4.0%. A rise above 4.15% would complete a small double bottom, signaling a test of resistance at 4.60%: a positive sign for equities. A further fall in yields would signal that funds are flowing out of equities and into bonds (confirmed if there is a corresponding fall in Twiggs Money Flow on the major indices).
The yield differential (10-year T-notes minus 13-week T-bills) below 1.0% is a (long-term) bear signal for equities.
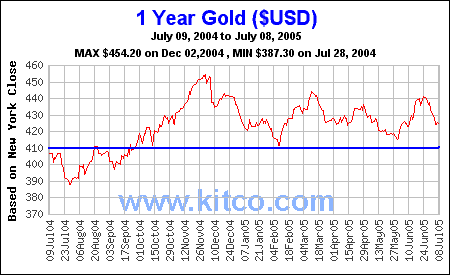
Gold
New York: Spot gold closed the week at $422.70. Expect a test of intermediate support at $415. The metal has formed a bearish descending triangle pattern since November 2004. A close below $415 would be a bear signal; but far stronger if price falls below long-term support at $410.
New York: Spot gold closed the week at $422.70. Expect a test of intermediate support at $415. The metal has formed a bearish descending triangle pattern since November 2004. A close below $415 would be a bear signal; but far stronger if price falls below long-term support at $410.
United Kingdom
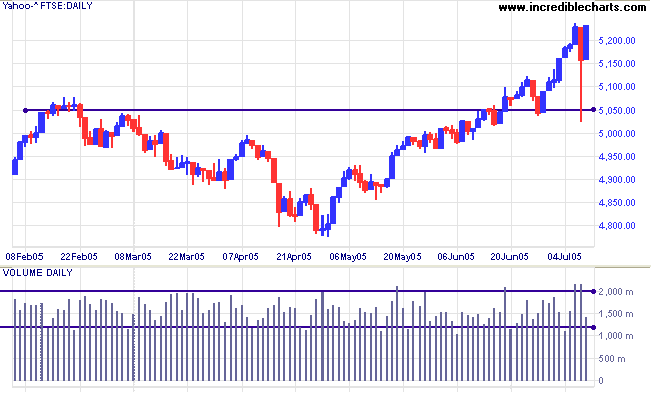
Panic selling triggered by the terrorist attack on London was soon absorbed and Thursday's candle closed with a very long tail. The recovery continued Friday with a tall blue candle, albeit on lower volume. The FTSE 100 is in a strong primary up-trend and single events seldom change the long-term direction of the market. However, we may see a separate, intermediate effect, with a secondary correction testing support at 5050 (the February high).
Panic selling triggered by the terrorist attack on London was soon absorbed and Thursday's candle closed with a very long tail. The recovery continued Friday with a tall blue candle, albeit on lower volume. The FTSE 100 is in a strong primary up-trend and single events seldom change the long-term direction of the market. However, we may see a separate, intermediate effect, with a secondary correction testing support at 5050 (the February high).
The latest version of Incredible Charts allows users to import
data from a third party - Yahoo.com.
If testing is successful, the new version will be released later this month.
If testing is successful, the new version will be released later this month.
ASX Australia
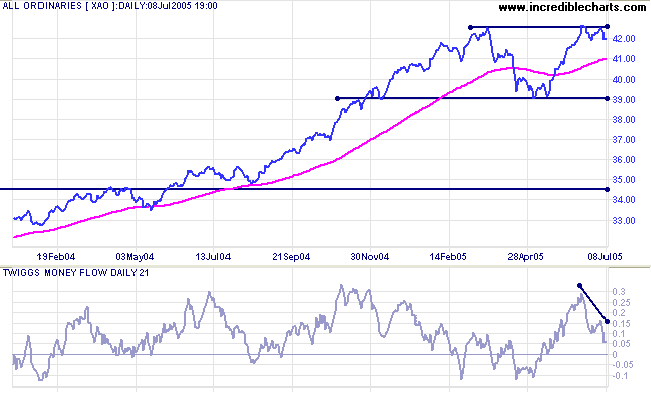
The All Ordinaries is at a watershed. Further consolidation in a narrow band below resistance at 4260/4275 would signal the likelihood of a bullish breakout and continuation of the primary up-trend. But if support at 4180 fails, expect a test of support at 3900.
The tall shadow at [3] signals increased selling at the 4260 resistance level, while the long tail at [5] signals buying support. Low volume at [5] suggests that support may fail. Watch US indices closely, though, as they exert sufficient influence to move the market either way.
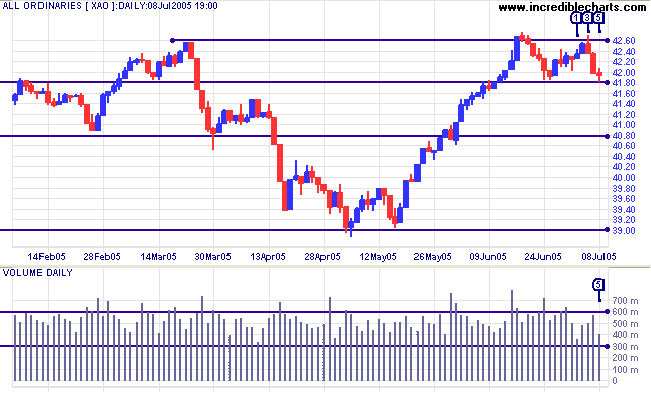
Twiggs Money Flow (21-day) displays a sharp bearish
divergence signaling selling pressure (which supports a re-test
of 3900).
A fall below 3900 would complete a double top formation, signaling that a test of 3450 is likely. On the other hand, if support holds at 3900 the primary trend is intact and we can expect further gains.
The All Ords' overall prospects are bearish. However, a breakout above 4260, followed by a pull-back that respects the new support level, is still a possibility and would signal further gains. The target would be 4620 (4260 + (4260 - 3900)).
For further assistance, read About
the Trading Diary.
Colin Twiggs
Never give in - never, never, never, never,
in nothing great or small, large or petty, never give in
except to convictions of honor and good sense.
Never yield to force; never yield to the apparently
overwhelming might of the enemy.
- Winston Churchill (October 1941)
in nothing great or small, large or petty, never give in
except to convictions of honor and good sense.
Never yield to force; never yield to the apparently
overwhelming might of the enemy.
- Winston Churchill (October 1941)

Author: Colin Twiggs is a former investment banker with almost 40 years of experience in financial markets. He co-founded Incredible Charts and writes the popular Trading Diary and Patient Investor newsletters.
Using a top-down approach, Colin identifies key macro trends in the global economy before evaluating selected opportunities using a combination of fundamental and technical analysis.
Focusing on interest rates and financial market liquidity as primary drivers of the economic cycle, he warned of the 2008/2009 and 2020 bear markets well ahead of actual events.
He founded PVT Capital (AFSL No. 546090) in May 2023, which offers investment strategy and advice to wholesale clients.