Trading Diary
May 21, 2005
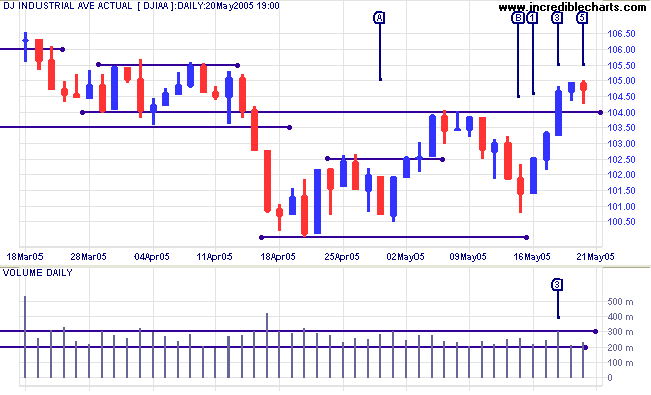
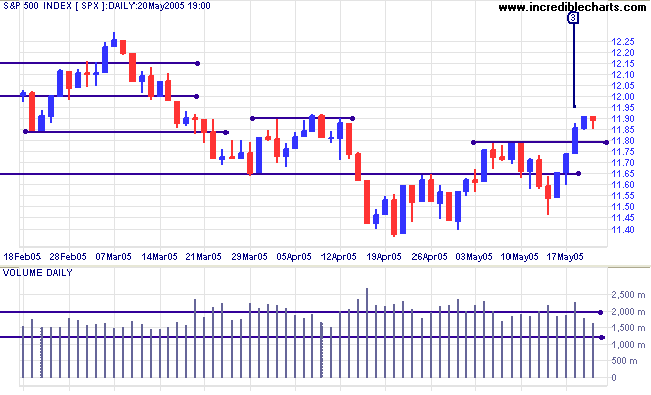
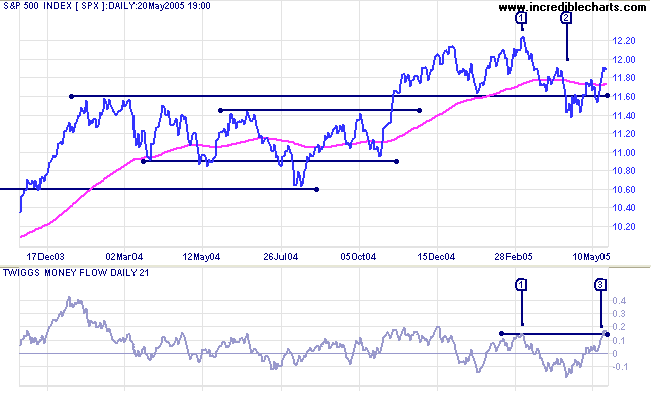
The Dow Industrial Average is clearly in an intermediate up-trend, after higher lows at [A] and [B]. The index broke above resistance from the previous high on Wednesday [3] with a strong blue candle and increased volume. Subsequent consolidation above the new support level on light volume indicates that buying pressure has eased. If the index respects support at 10400 that would be a bullish sign. A close above 10500 would signal that a test of resistance at 10900 is likely. A close below 10400, on the other hand, would signal a re-test of support at 10000.
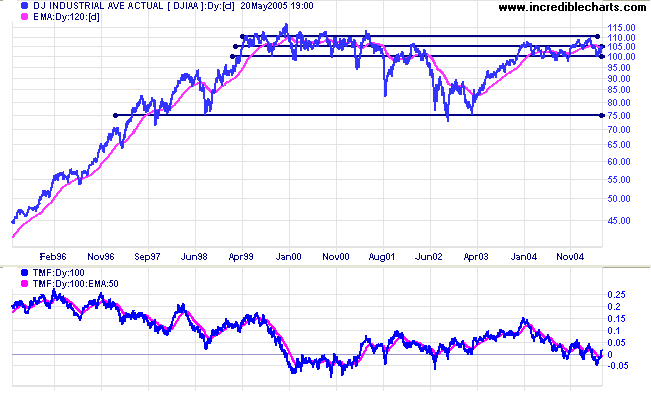
Twiggs Money Flow (100-day) continues to signal distribution.
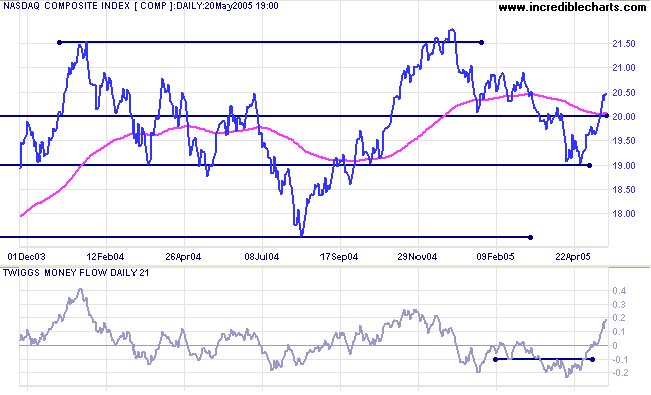
Twiggs Money Flow (21-day) is climbing steeply, signaling accumulation (intermediate term).
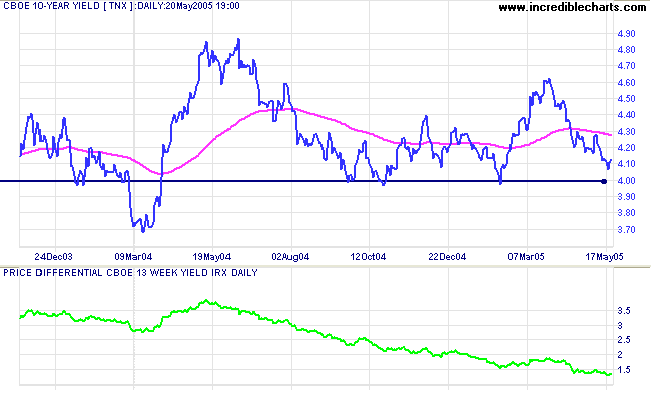
The yield on 10-year treasury notes is headed for a test of support at 4.0%.
The yield differential (10-year T-notes minus 13-week T-bills) has declined to 1.3%. Below 1.0% would be a long-term bear signal for equities.
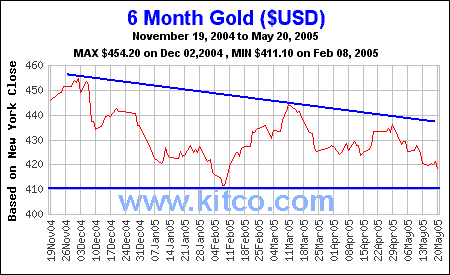
New York: Spot gold fell to $417.30, after flirting with support/resistance at $420 for most of the week..
The primary trend will reverse downward if price falls below the February low of $410.
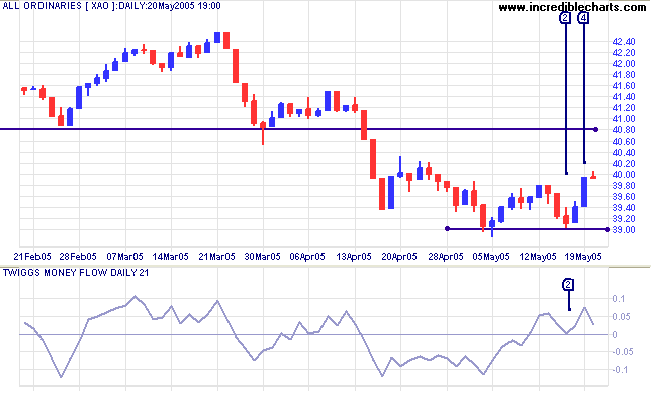
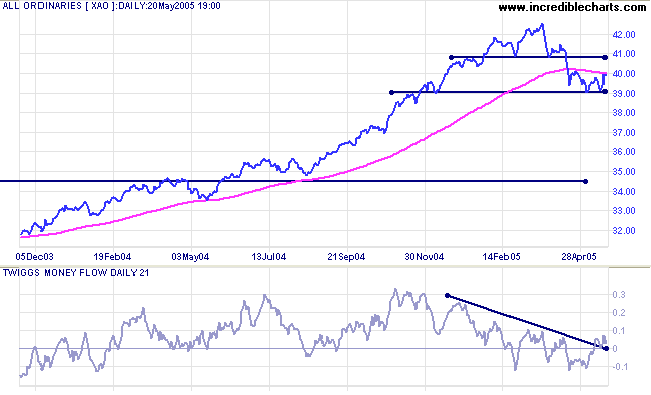
The All Ordinaries has encountered solid support at 3900, after positive signals from US markets. Twiggs Money Flow (21-day) formed a bullish trough above the zero line at [2]. This was followed by a close above 3980 at [4]. Expect a test of resistance at 4080.
That's why I tell people, and I really mean it literally, if you're not doing something that really turns you on, do something that does turn you on.......... Those people die with a sense of achievement, of priding themselves that they had the guts to do it.
~ Elizabeth Kubler-Ross
http://www.healthy.net/scr/interview.asp?PageType=Interview&ID=205
Back Issues

Author: Colin Twiggs is a former investment banker with almost 40 years of experience in financial markets. He co-founded Incredible Charts and writes the popular Trading Diary and Patient Investor newsletters.
Using a top-down approach, Colin identifies key macro trends in the global economy before evaluating selected opportunities using a combination of fundamental and technical analysis.
Focusing on interest rates and financial market liquidity as primary drivers of the economic cycle, he warned of the 2008/2009 and 2020 bear markets well ahead of actual events.
He founded PVT Capital (AFSL No. 546090) in May 2023, which offers investment strategy and advice to wholesale clients.
