Trading Diary
May 14, 2005
These extracts from my daily trading diary are
for educational purposes and should not be interpreted as
investment advice. Full terms and conditions can be found at
Terms
of Use.
USA
The Dow Industrial Average failed to penetrate resistance at 10400, adding further confirmation of the down-trend. The long tail and higher volume at [5] indicates buying support above 10000. If support holds we can expect consolidation between 10000 and 10400.
The Dow Industrial Average failed to penetrate resistance at 10400, adding further confirmation of the down-trend. The long tail and higher volume at [5] indicates buying support above 10000. If support holds we can expect consolidation between 10000 and 10400.
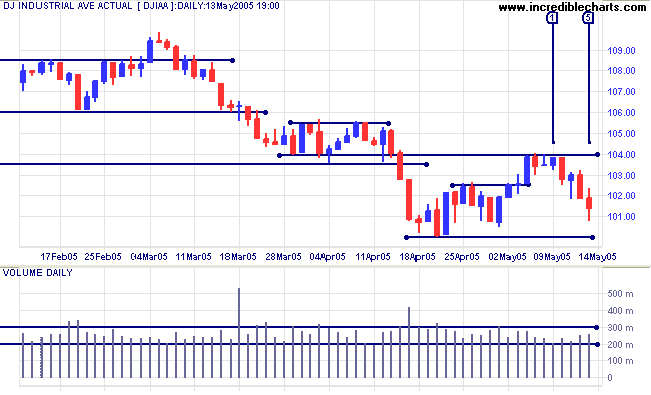
Expect buying support between 10000 and 9750, the October low. If
that fails we could face a re-test of the March 2003 low at
7500.
Twiggs Money Flow (21-day) signals distribution. The indicator rose above the previous peak but reversed below the zero line at [w].
Twiggs Money Flow (21-day) signals distribution. The indicator rose above the previous peak but reversed below the zero line at [w].
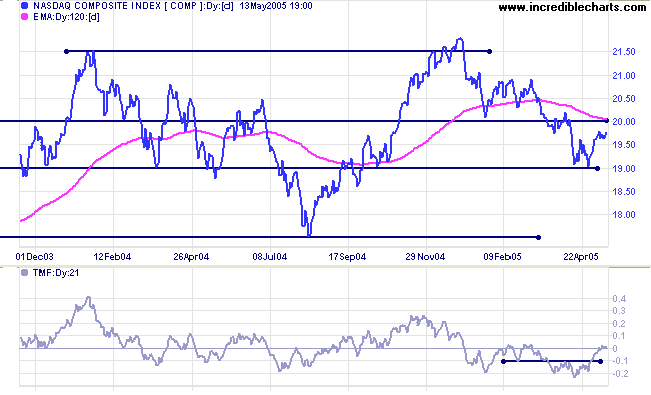
The Nasdaq Composite consolidated in a narrow band over
the last week. Expect strong resistance at 2000; committed
support at 1900. A close outside this range would be significant:
below 1900 would signal that a test of 1750 is likely; above 2000
would mean another test of resistance at 2150.
Twiggs Money Flow (21-day) has rallied above recent highs but is still bearish, remaining at zero.
Twiggs Money Flow (21-day) has rallied above recent highs but is still bearish, remaining at zero.
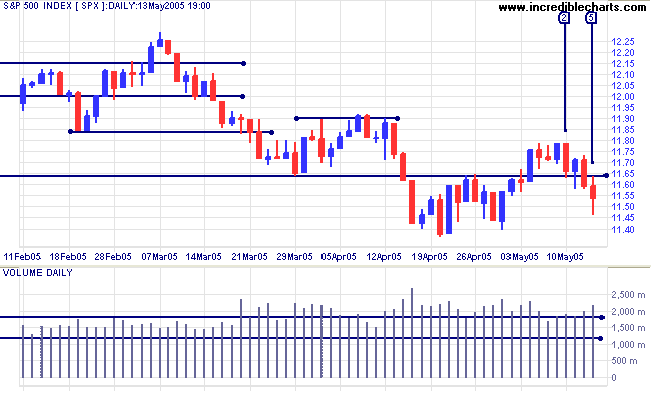
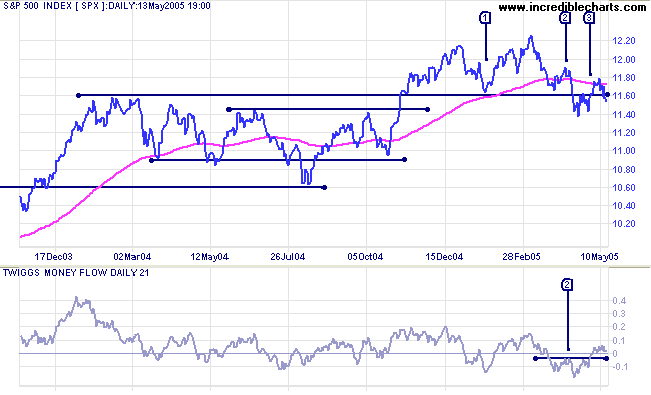
Take a look at volume on the S&P 500 over the last 2
months: a large number of bars signal unusual trading activity.
If that was driven by sellers alone, the index would already have
fallen through the floor. Why hasn't this happened? Friday's long
tail [5] and exceptional volume provide a clue.
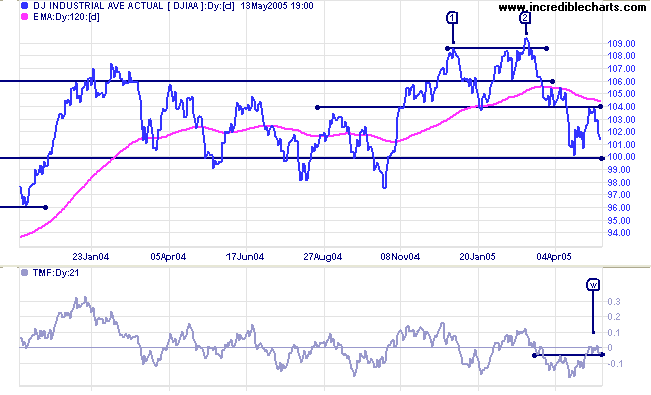
We have had a valid
Dow trend reversal: a fall below the previous secondary low
of [1]. Admittedly, the down-swing did not carry too far before
consolidating and then doubling back, but this still qualifies as
a down-trend.
Twiggs Money Flow (21-day) has climbed above the zero line,
outstripping the previous high at [2]. Could this be a
failure swing coming?
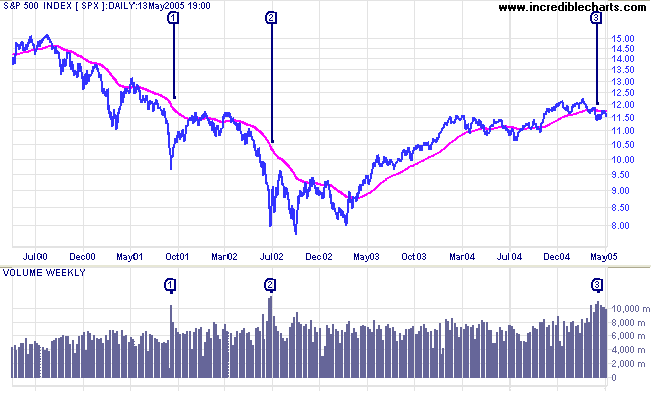
Looking at the chart below, this is only the third time in recent
history where weekly volume exceeds 10,000m. Previously, at [1]
and [2], the market had been sold down too far, offering
exceptional value, and the big money stepped in to buy. If that
is the case now, why do indicators such as Twiggs Money Flow not
signal Accumulation? Because the buying
is against the trend.
Is this definite? No. There may be other factors causing the unusual activity.
Is it suspicious? Yes.
How can we confirm? Look for divergences or failure swings on Twiggs Money Flow (or other Accumulation indicators) and a close above 1180. A close below 1140 would signal that all bets are off -- and the down-trend continues.
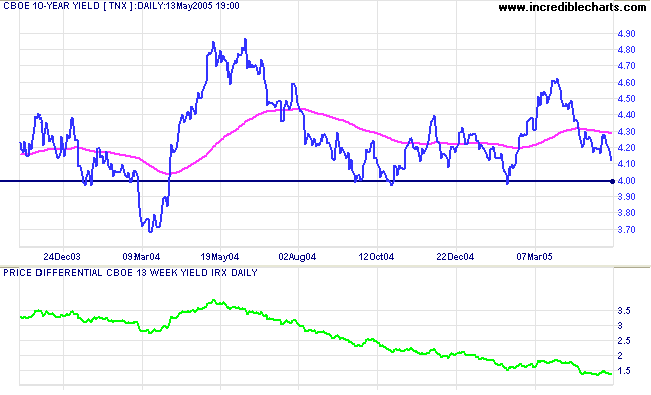
Treasury yields
The yield on 10-year treasury notes is headed for another test of support at 4.0%.
The yield differential (10-year T-notes minus 13-week T-bills) is declining (currently 1.4%). Below 1.0% would be a long-term bear signal for equities.
The yield on 10-year treasury notes is headed for another test of support at 4.0%.
The yield differential (10-year T-notes minus 13-week T-bills) is declining (currently 1.4%). Below 1.0% would be a long-term bear signal for equities.
Gold
New York: Spot gold closed at $419.70, having fallen through support at $420.
The most difficult task in trend analysis is distinguishing what is or is not a secondary reaction or a valid line, where price fluctuates in a narrow range over several weeks. Charles Dow used time as the main determinant: a secondary reaction must last for a minimum number of weeks. However his writings were not always consistent and the required number of weeks varies between two and four, as the theory was evolved by Dow, Nelson, Hamilton and later Rhea. Robert Rhea points out, in his book The Dow Theory, that trend analysis is as much an art as a science and that rigid adherence to a strict set of rules will not always deliver the best results. The analyst must, to some extent, use his own discretion in evaluating what is significant and what isn't.
Which brings me back to the gold chart. We have had several sharp falls of +/- 5% lasting no more than a week, interspersed with weak rallies and two lines that formed between $420 and $430 (the first in January, the second in March/April), each lasting about 3 weeks. Subsequent price action tells me that the latest line has no great significance and that the fall below $420 is merely a continuation of the secondary correction started on March 16, and not a primary trend change. The primary trend will reverse downward if price falls below the February low of $410.
ASX Australia
The All Ordinaries is no longer in a hard down-trend, having crossed back above resistance at 3940. The market is indecisive at present, with the index trading in a narrow range between 3940 and 3980. Long tails at [2] [3] and [5] signal buying support but the market is vulnerable to bad news and could easily be panicked into another sharp fall. If the index breaks above 3980, expect a test of resistance at 4080.
The All Ordinaries is no longer in a hard down-trend, having crossed back above resistance at 3940. The market is indecisive at present, with the index trading in a narrow range between 3940 and 3980. Long tails at [2] [3] and [5] signal buying support but the market is vulnerable to bad news and could easily be panicked into another sharp fall. If the index breaks above 3980, expect a test of resistance at 4080.
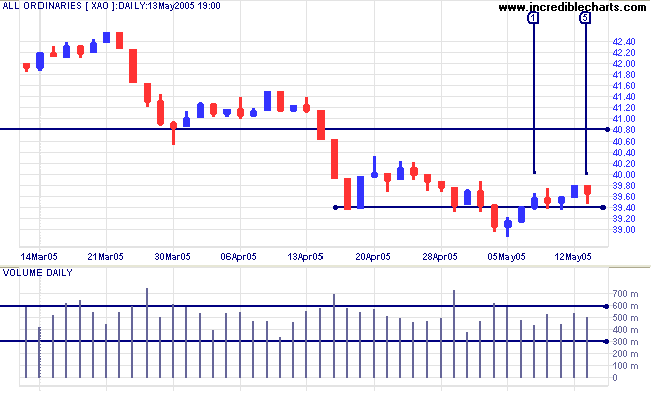
Twiggs Money Flow (21-day) returned above the zero line but
still appears weak.
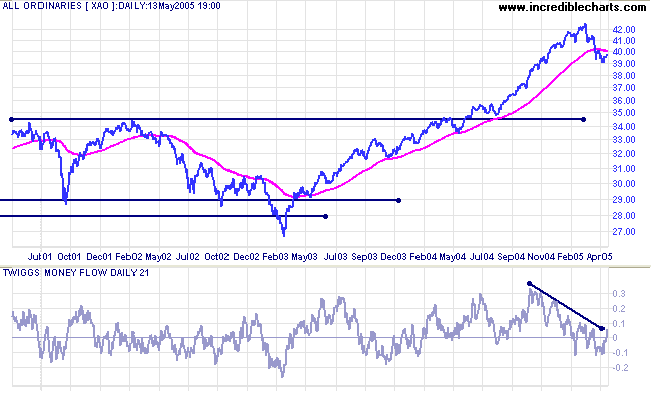
The primary trend is downwards. Failure of support at 3900 will
signal that a test of support at 3450 is likely, amounting to
roughly a 50% retracement of the previous up-trend. If you review
the
All Ords over the past 25 years, the index has regularly cut
back to test support at previous highs.
For further assistance, read About
the Trading Diary.
Colin Twiggs
There are risks and costs to a program of action.
But they are far less than the long-range risks
and costs of comfortable inaction.
~ John F Kennedy
But they are far less than the long-range risks
and costs of comfortable inaction.
~ John F Kennedy
Back Issues
Access the Trading Diary Archives.

Author: Colin Twiggs is a former investment banker with almost 40 years of experience in financial markets. He co-founded Incredible Charts and writes the popular Trading Diary and Patient Investor newsletters.
Using a top-down approach, Colin identifies key macro trends in the global economy before evaluating selected opportunities using a combination of fundamental and technical analysis.
Focusing on interest rates and financial market liquidity as primary drivers of the economic cycle, he warned of the 2008/2009 and 2020 bear markets well ahead of actual events.
He founded PVT Capital (AFSL No. 546090) in May 2023, which offers investment strategy and advice to wholesale clients.