Trading Diary
April 23, 2005
The Dow Industrial Average ran into support at 10000 on Monday, with buying signaled by the long tail at [1]. A brief rally followed before further selling took over at [3]; strong volume qualifies this as another distribution day [d]. A strong blue bar on Thursday [4] signaled further buying support before the Alan Greenspan's warning to the Senate Budget Committee, about growing deficits and rising interest rates, caused a hesitant sell-off on Friday.
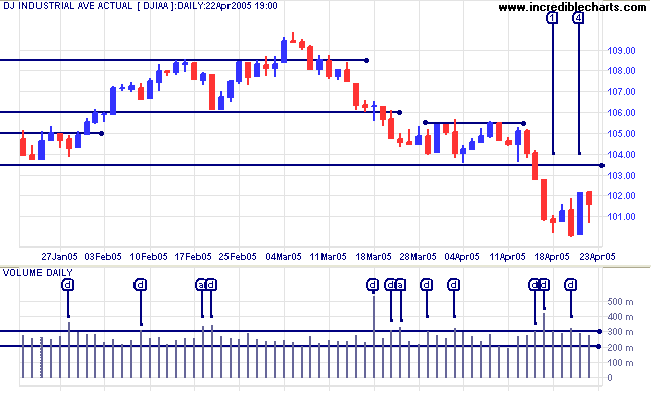
Will support at 10000 hold? The round number is a strong psychological barrier. The longer the index holds above 10000 the greater the chance that the primary down-trend will fizzle out. A close below this level, on the other hand, is likely to trigger a fresh spate of selling. A fall below 9750 would signal that a test of support at 7500 (from March 2003) is likely. We have had a valid Dow trend reversal and completed a double-top, at [1] and [2] on the chart below, so I believe that support at 10000 will more than likely fail. If there is a rally above 10350 we will have to re-evaluate.
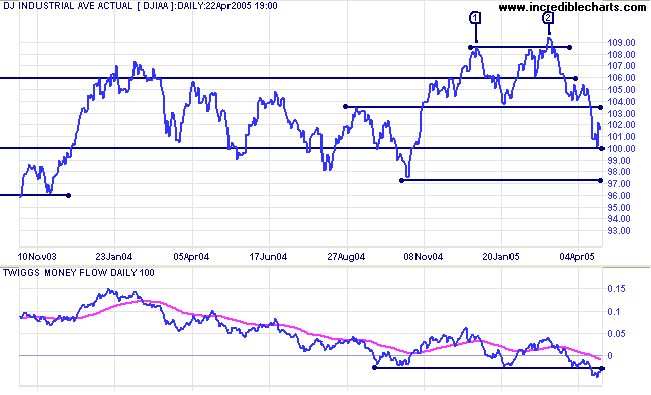
Twiggs Money Flow (100-day) signals strong distribution, with peaks below the signal line followed by new lows.
Expect a test of support at 1750. Failure of that level could see the index test 1250.
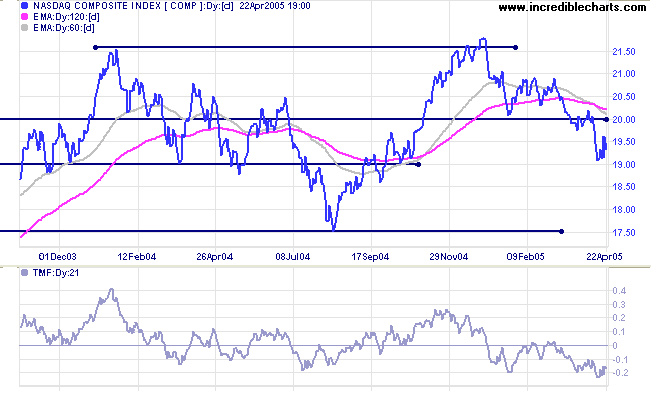
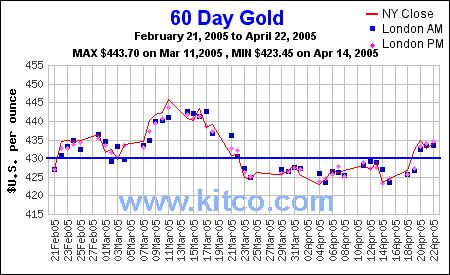
The S&P 500 looks the strongest of the 3 major indexes: we have seen three accumulation days and one distribution day in the past week. Expect a test of resistance at 1165 in the next few days. If that fails then the primary down-trend will appear uncertain. This does not mean that the up-trend will have resumed; just that tops are volatile and often take time to resolve into a clear direction.
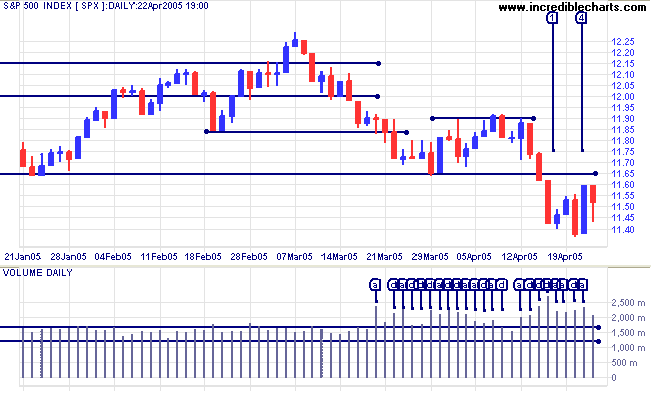
If resistance at 1165 holds, then we can expect a test of support at 1060. If that fails, the next level is the round number of 1000.
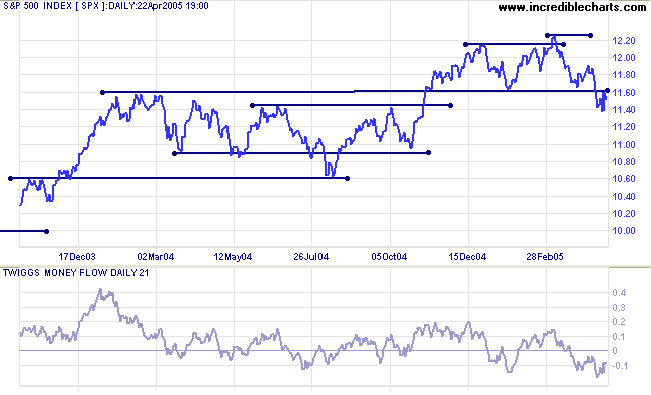
The yield on 10-year treasury notes appears headed for another test of support at 4.0%.
The yield differential (10-year T-notes minus 13-week T-bills) fell to 1.4%. Below 1.0% would be a long-term bear signal for equities.
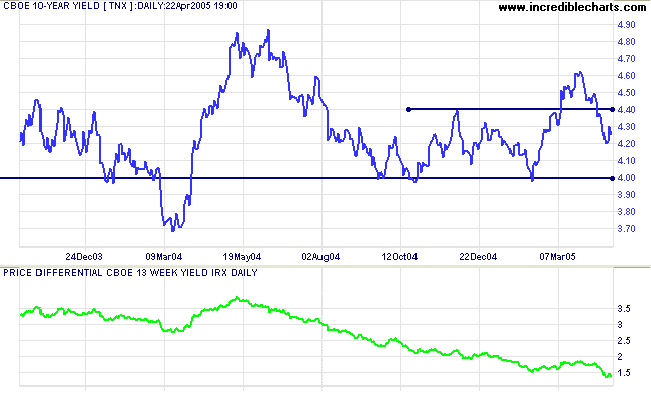
New York: Spot gold broke back through resistance at $430, closing the week at $433.70. The upward breakout is likely to test resistance at $445 (the March high). If that resistance level holds, it will be a (long-term) bear signal: a double top below primary resistance (at $450).
The inverse happens in a down-trend: bear signal if there is a narrow consolidation above support; greater uncertainty if there is a narrow consolidation below a former support level (i.e. below newly-formed resistance).
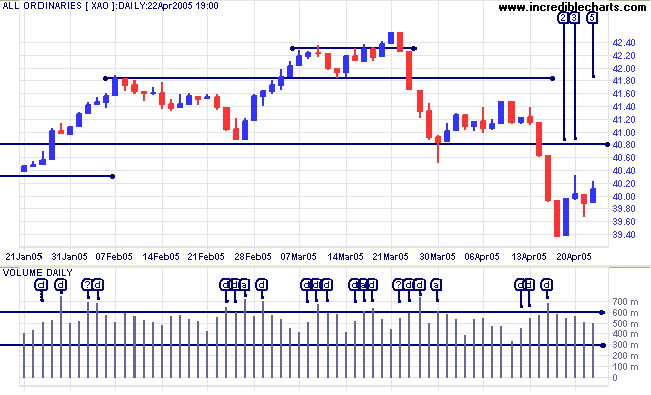
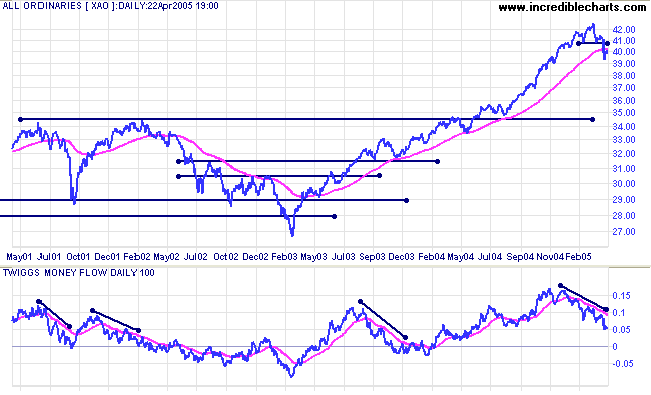
The All Ordinaries last week completed a primary trend reversal. This week, the sharp correction ended with an attempted rally at [2]. Volume was insufficient and the rally ran into heavy selling at [3]: signaled by the very weak close. Further buyers emerged towards the end of Thursday (note the long tail) and continued on Friday [5]. Volumes are too low for the rally to be significant and I expect a continuation of the down-trend. This would be confirmed by a fall below Monday's low of 3940.
A rally back above 4080 would mean that all bets are off and the top formation may continue.
- Blaise Pascal.
Back Issues

Author: Colin Twiggs is a former investment banker with almost 40 years of experience in financial markets. He co-founded Incredible Charts and writes the popular Trading Diary and Patient Investor newsletters.
Using a top-down approach, Colin identifies key macro trends in the global economy before evaluating selected opportunities using a combination of fundamental and technical analysis.
Focusing on interest rates and financial market liquidity as primary drivers of the economic cycle, he warned of the 2008/2009 and 2020 bear markets well ahead of actual events.
He founded PVT Capital (AFSL No. 546090) in May 2023, which offers investment strategy and advice to wholesale clients.
