Trading Diary
April 16, 2005
These extracts from my daily trading diary are for educational
purposes and should not be interpreted as investment advice. Full
terms and conditions can be found at Terms
of Use.
USA
The Dow Industrial Average completed a primary trend reversal with a fall below support at 10350.
Monday [1] signaled an absence of sellers with a narrow range and low volume. After testing support, Tuesday attempted a rally but failed to test resistance at 10550 ahead of Wednesday's strong red candle. Thursday [4] closed below primary support on strong volume, signaling a primary trend reversal. Friday continued with massive distribution as the market reacted to the trend change.
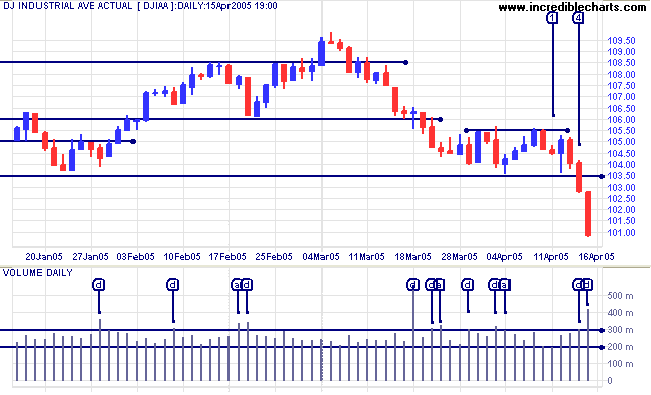
Twiggs Money Flow (100-day) is below previous lows, signaling
strong distribution.
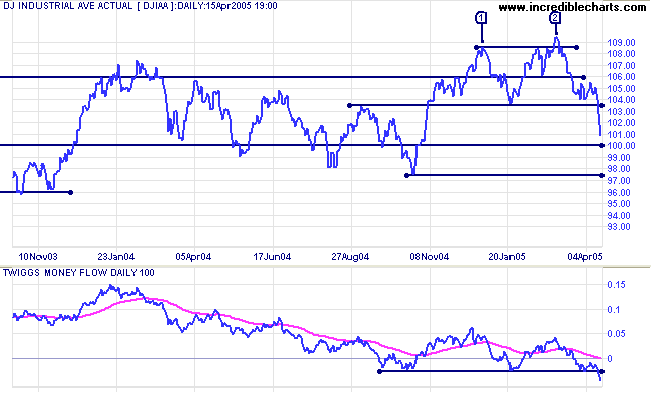
On the longer term chart we can see that the Dow has completed a double top, with equal highs at [1] and [2]. The false (marginal) break at [2] above the previous high [1] increased the likelihood of a bearish breakout.
Initial support is at the round number of 10000, with stronger support at the October low of 9750. If 9750 should fail then we could face another test of support at 7500 (from March 2003).
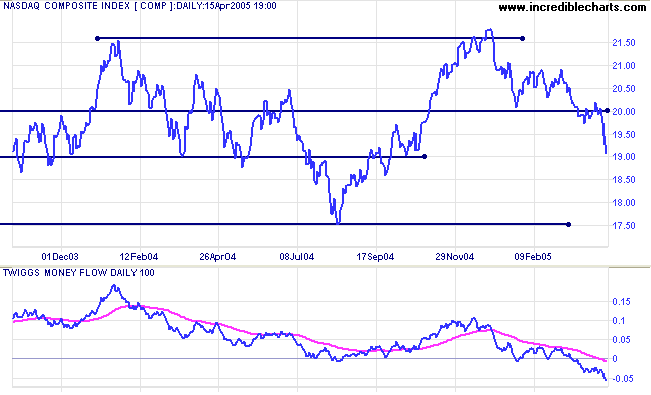
After briefly flirting with support at 2000, the Nasdaq
Composite fell sharply to confirm the primary
down-trend.
Twiggs Money Flow (100-day) signals strong distribution, with peaks below the signal line.
Support is at 1750. Failure of that level could see the index test 1250.
Twiggs Money Flow (100-day) signals strong distribution, with peaks below the signal line.
Support is at 1750. Failure of that level could see the index test 1250.
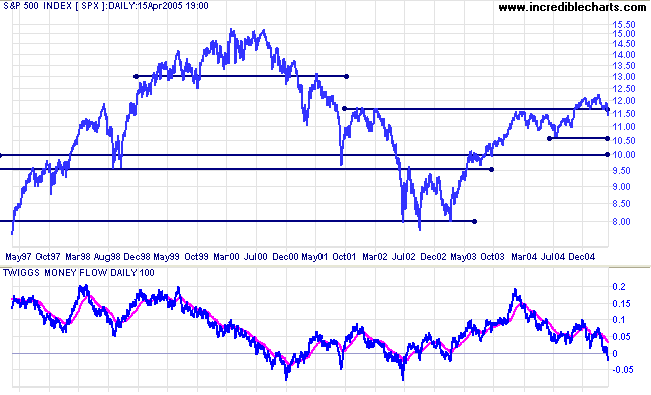
The S&P 500 has followed the NASDAQ and the Dow into a
primary down-trend. The week started quietly with a doji bar [1]
on low volume: signaling uncertainty. The attempted rally on
Tuesday failed to break resistance at 1190 and the sell-off
followed with strong red candles and increasing volumes. Thursday
[4] closed below the primary support level of 1165, signaling a
trend reversal, and selling reached a crescendo on Friday as the
market recognized the trend-change.
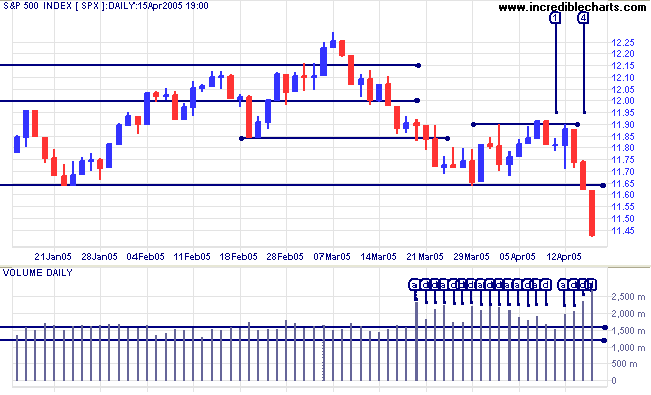
Twiggs Money Flow (100-day) signals distribution.
The first line of support is at 1060. If that fails the next support level is the psychological barrier of 1000.
The first line of support is at 1060. If that fails the next support level is the psychological barrier of 1000.
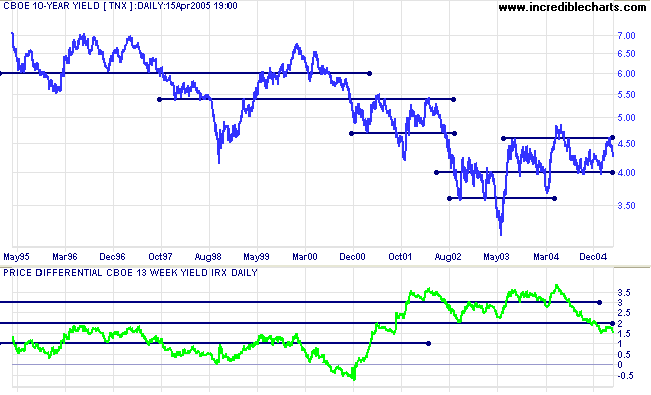
Treasury yields
The yield on 10-year treasury notes has pulled back to 4.30%. Though not as strong as initial indications, so long as support at 4.0% holds, the primary trend is still upwards.
The yield differential (10-year T-notes minus 13-week T-bills) fell to 1.55%. Below 1.0% would be considered a long-term bear signal for equity markets.
Gold
New York: Spot gold continues to consolidate below intermediate resistance at $430, closing at $424.30 on Friday. The longer that the consolidation continues, the less certain we can be about the likely direction of the breakout. A downward breakout (below $420) would likely test primary support at $410; an upward breakout would test resistance at $445.
A fall below $410 would signal that the primary trend has reversed; while another secondary peak below $450 would also be a strong bear signal.
ASX Australia
The All Ordinaries has completed a primary trend reversal. The week started with a red candle at [1] but on very light volume. Tuesday and Wednesday [3] display narrow ranges with zero net gain despite increased volume; signaling distribution. They are followed by a strong red candle on Thursday, closing below the primary support level at 4080 and signaling a primary trend reversal. Reaction to the trend change set in on Friday [5], with strong selling as traders cleared their positions.
The All Ordinaries has completed a primary trend reversal. The week started with a red candle at [1] but on very light volume. Tuesday and Wednesday [3] display narrow ranges with zero net gain despite increased volume; signaling distribution. They are followed by a strong red candle on Thursday, closing below the primary support level at 4080 and signaling a primary trend reversal. Reaction to the trend change set in on Friday [5], with strong selling as traders cleared their positions.
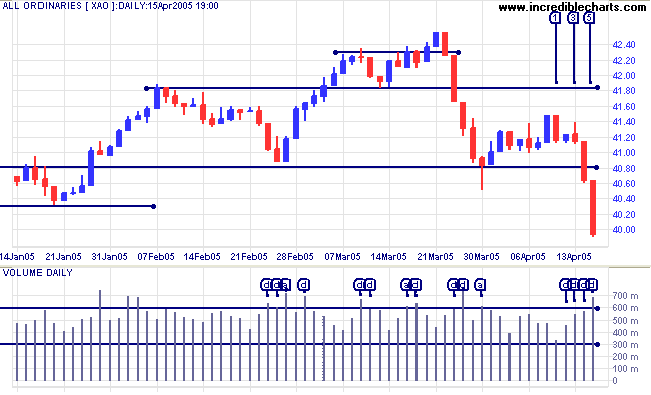
The distribution signal from
Twiggs Money Flow (100-day) had forewarned us of the market
correction. If anything the signal was too early, with bearish
divergences well before the top. This would amount to roughly a
50% retracement of the primary up-trend.
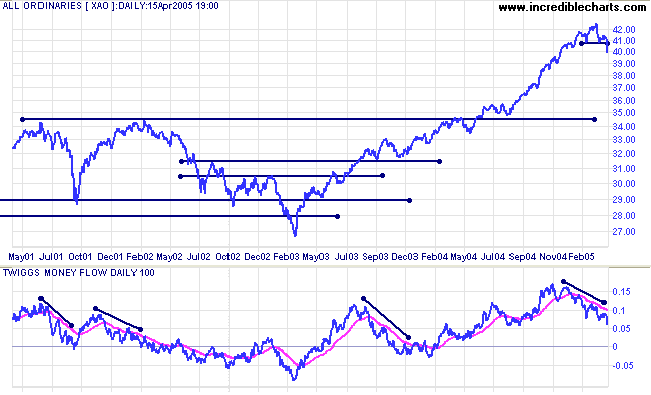
The correction is likely to test support at the 2002 high of
3450. This is based on observation of the
All Ords over the past 25 years: the index has regularly cut
back to test support at previous highs during an up-trend.
For further assistance, read About
the Trading Diary.
Colin Twiggs
Sometimes the best trades are not the winning ones that put money
in your pocket;
sometimes they are the ones that get you out of the market at the right time.
~ Phil Flynn
sometimes they are the ones that get you out of the market at the right time.
~ Phil Flynn
Back Issues
Access the Trading Diary Archives.

Author: Colin Twiggs is a former investment banker with almost 40 years of experience in financial markets. He co-founded Incredible Charts and writes the popular Trading Diary and Patient Investor newsletters.
Using a top-down approach, Colin identifies key macro trends in the global economy before evaluating selected opportunities using a combination of fundamental and technical analysis.
Focusing on interest rates and financial market liquidity as primary drivers of the economic cycle, he warned of the 2008/2009 and 2020 bear markets well ahead of actual events.
He founded PVT Capital (AFSL No. 546090) in May 2023, which offers investment strategy and advice to wholesale clients.