Trading Diary
April 9, 2005
These extracts from my daily trading diary are for educational
purposes and should not be interpreted as investment advice. Full
terms and conditions can be found at Terms
of Use.
USA
The Dow Industrial Average continues to consolidate above support at 10350. Monday displays a long tail at [1] accompanied by strong volume, signaling accumulation [a]. This is followed by three days rally ending at resistance at 10550. The downswing, Friday, with a strong red bar on light volume, indicates an absence of buyers but no real selling pressure. Expect another test of primary support at 10350. A close below this level would signal a primary trend reversal.
The Dow Industrial Average continues to consolidate above support at 10350. Monday displays a long tail at [1] accompanied by strong volume, signaling accumulation [a]. This is followed by three days rally ending at resistance at 10550. The downswing, Friday, with a strong red bar on light volume, indicates an absence of buyers but no real selling pressure. Expect another test of primary support at 10350. A close below this level would signal a primary trend reversal.
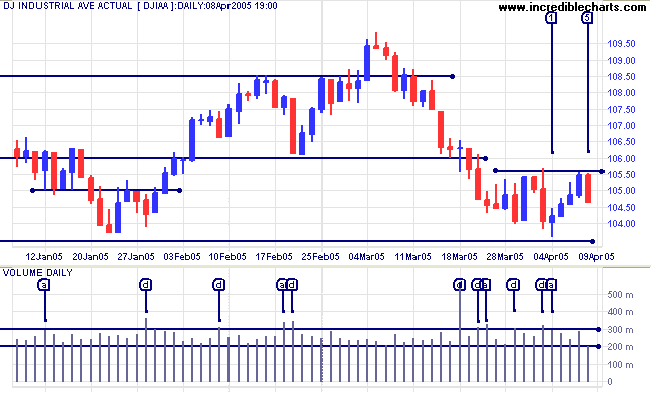
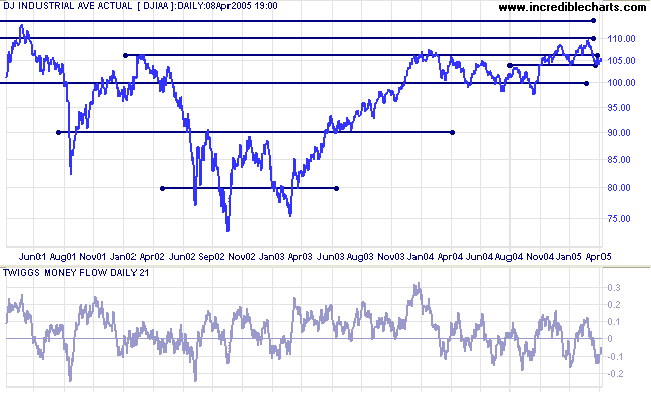
In the longer term, if the index respects support at 10350 we are
likely to witness further consolidation between 11000 and 10350.
There is heavy overhead resistance at 11000 to 11650 (the
previous high).
Twiggs Money Flow (21-day) is fluctuating around the zero line, signaling uncertainty (consolidation).
Twiggs Money Flow (21-day) is fluctuating around the zero line, signaling uncertainty (consolidation).
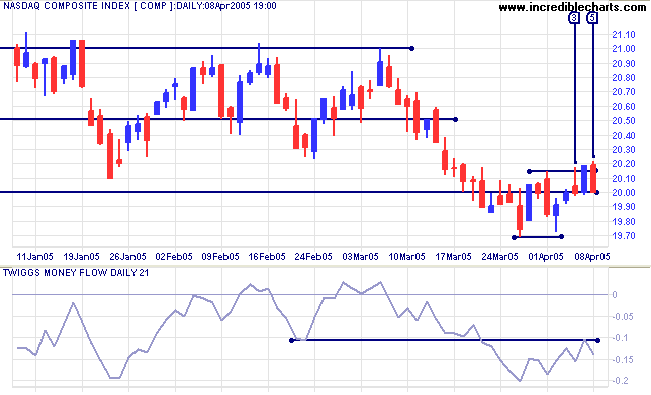
The Nasdaq Composite has twice retreated back above 2000
since signaling a primary trend reversal, with a fall below the
support level. The latest rally broke through resistance at [3]
but immediately lost momentum and ended with a weak close on the
same day. A further test of support is evident at 2000 on day
[5].
Twiggs Money Flow signals strong distribution. A fall below 1970 on the index would confirm the down-trend and may precede weakness in other indexes.
Twiggs Money Flow signals strong distribution. A fall below 1970 on the index would confirm the down-trend and may precede weakness in other indexes.
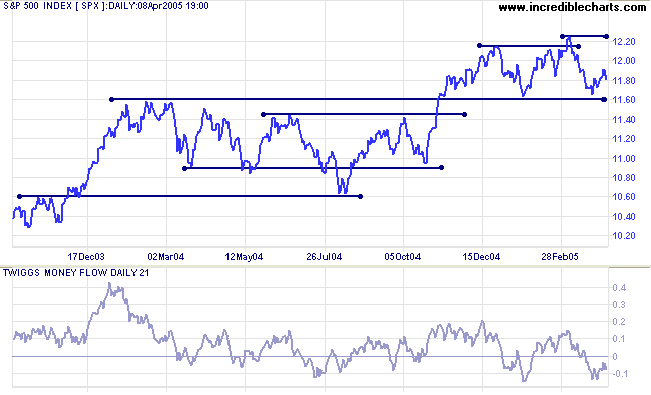
The S&P 500 has displayed high volumes since the
triple-witching
day on March 18. Sellers have lost control of the market,
with accumulation [a] evident on Monday [1], Tuesday and
Thursday. Friday [5] is the only distribution day [d] recorded
for the week.
I have amended my definition of accumulation and distribution days: volume need not be higher than the previous day but must be above normal trading activity (in the top 10% of volume days).
Expect a test of short-term support at 1170. Primary support is just below at 1160.
I have amended my definition of accumulation and distribution days: volume need not be higher than the previous day but must be above normal trading activity (in the top 10% of volume days).
Expect a test of short-term support at 1170. Primary support is just below at 1160.
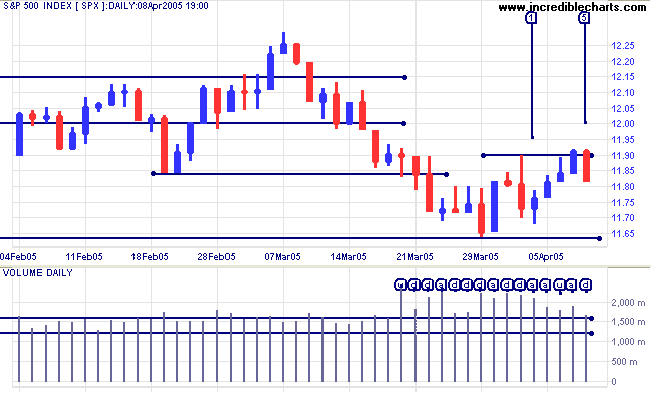
On the longer-term chart, the index is consolidating between 1160
and 1225. A close below 1160 would signal a primary trend
reversal, with a likely test of support at 1060.
Twiggs Money Flow (21-day) is fluctuating around the zero line, signaling uncertainty. A peak below zero would be a bear signal.
Twiggs Money Flow (21-day) is fluctuating around the zero line, signaling uncertainty. A peak below zero would be a bear signal.
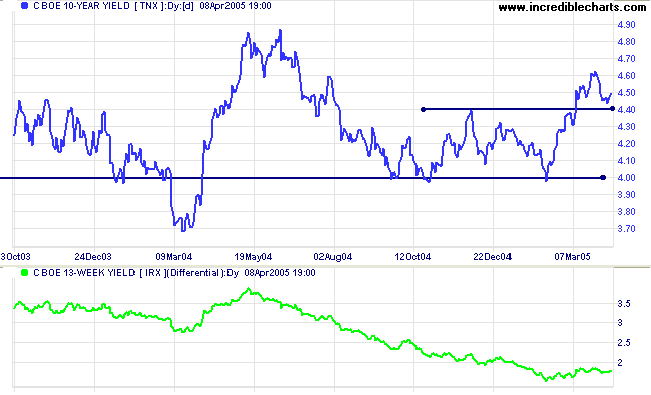
Treasury yields
The yield on 10-year treasury notes pulled back to test support at 4.40%. If support holds, that will signal the start of a strong up-trend. Confirmation would be a rise above the previous peak of 4.60%.
The yield differential (10-year T-notes minus 13-week T-bills) increased to 1.8%. A differential below 1.0% is considered a long-term bear signal for equity markets.
Gold
New York: Spot gold continues to consolidate below intermediate resistance at $430, closing at $426.50 on Friday. The intermediate trend is downwards and we can expect a test of primary support at $410.
A fall below $410 would signal that the primary trend has reversed; while another secondary peak below $450 would also be a strong bear signal.
ASX Australia
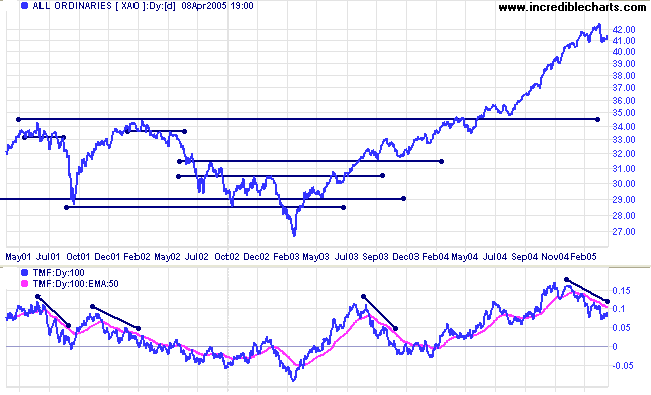
Australian investors may have breathed a sigh of relief this week as the All Ordinaries held above the primary support level at 4080. Selling into the latest rally has been remarkably light, with Wednesday the only significant day. There is low volume at [1] but higher volume on the reversal at [3]. The break through short-term resistance at 4140 on a strong blue candle looks promising.
Expect the index to test resistance at 4180, the previous intermediate low.
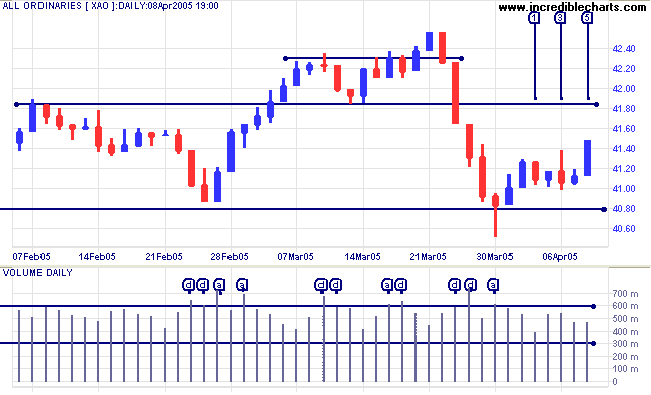
The distribution signal from
Twiggs Money Flow (100-day) warns that the market is likely
to consolidate or correct.
Watch for the following warning signs of a market top:
Watch for the following warning signs of a market top:
- increased volatility;
- repeated failure to break through resistance at 4180;
- a false (marginal) break above the high at 4250; or, most obviously,
- a close below 4080, signaling a primary trend reversal.
Weekly reminder:
At some point there is likely to be a correction back to 3450. This is based on observation of the All Ords over the past 25 years, where the index has regularly cut back to test support at previous highs during an up-trend.
At some point there is likely to be a correction back to 3450. This is based on observation of the All Ords over the past 25 years, where the index has regularly cut back to test support at previous highs during an up-trend.
For further assistance, read About
the Trading Diary.
Colin Twiggs
The easiest solution is often hidden behind our belief that
things are difficult.
~ Comment from Trygve on Experts Exchange
~ Comment from Trygve on Experts Exchange
Back Issues
Access the Trading Diary Archives.

Author: Colin Twiggs is a former investment banker with almost 40 years of experience in financial markets. He co-founded Incredible Charts and writes the popular Trading Diary and Patient Investor newsletters.
Using a top-down approach, Colin identifies key macro trends in the global economy before evaluating selected opportunities using a combination of fundamental and technical analysis.
Focusing on interest rates and financial market liquidity as primary drivers of the economic cycle, he warned of the 2008/2009 and 2020 bear markets well ahead of actual events.
He founded PVT Capital (AFSL No. 546090) in May 2023, which offers investment strategy and advice to wholesale clients.