Trading Diary
April 2, 2005
These extracts from my daily trading diary are
for educational purposes and should not be interpreted as
investment advice. Full terms and conditions can be found at
Terms
of Use.
USA
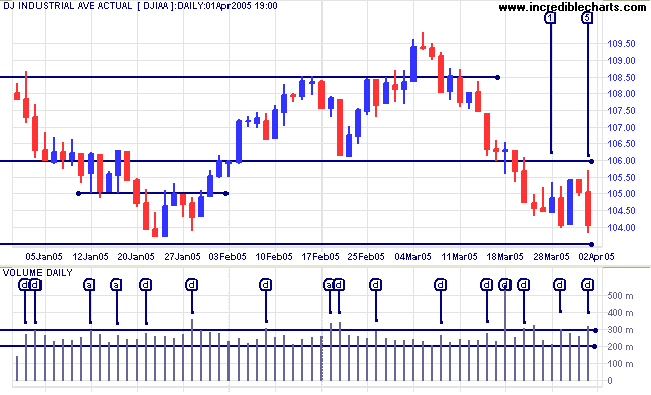
The Dow Industrial Average is consolidating above support at 10350. Strong volume is evident on red candles on days [2] and [5], signaling distribution. Expect a test of primary support at 10350. A close below this level would signal a primary trend reversal.
William O'Neil (How to Make Money in Stocks) maintains that four distribution days in a two week period signal that a market top is forming. I believe that this is an over-simplification but the number of distribution days [d], when compared to accumulation days [a] over the last quarter, is rising. This warns that sellers dominate the market.
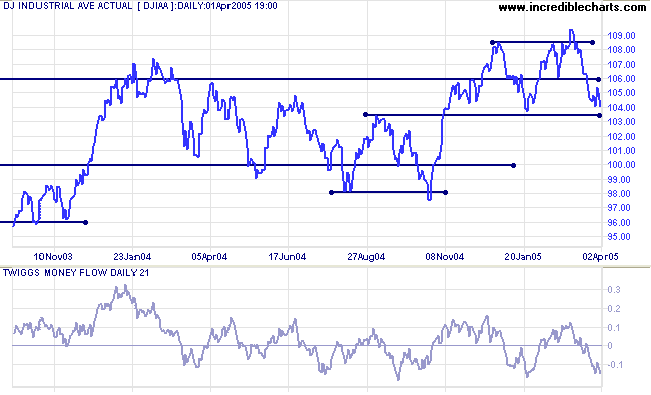
If the index respects support at 10350, we are likely to witness
further consolidation between 11000 and 10350. There is heavy
resistance overhead at 11000 to 11650 (the previous high).
Twiggs Money Flow (21-day) continues to decline, warning of further consolidation or correction. A fall below the January low would be an added bear signal.
Twiggs Money Flow (21-day) continues to decline, warning of further consolidation or correction. A fall below the January low would be an added bear signal.
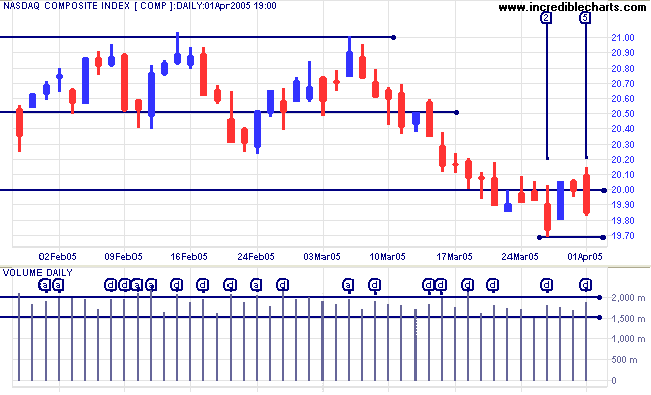
The Nasdaq Composite last week signaled a primary trend
reversal, closing below support at 2000. The index encountered
some uncertainty, whipsawing across the support level several
times before red candles and strong volume at [2] and [5]
signaled further distribution. A close below 1970, the last
intermediate low, would confirm the downward breakout; especially
if accompanied by increased volume.
The NASDAQ primary trend reversal may drag other indexes down as well.
Twiggs Money Flow continues to fall, confirming that sellers dominate the market.
The NASDAQ primary trend reversal may drag other indexes down as well.
Twiggs Money Flow continues to fall, confirming that sellers dominate the market.
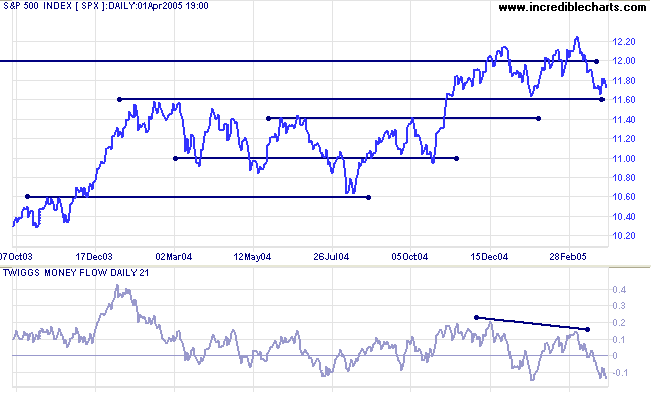
The S&P 500 continues to display high volumes while
consolidating below 1185. Sellers are in control, with three of
the last four days qualifying as
distribution days. Expect a test of primary support at 1160.
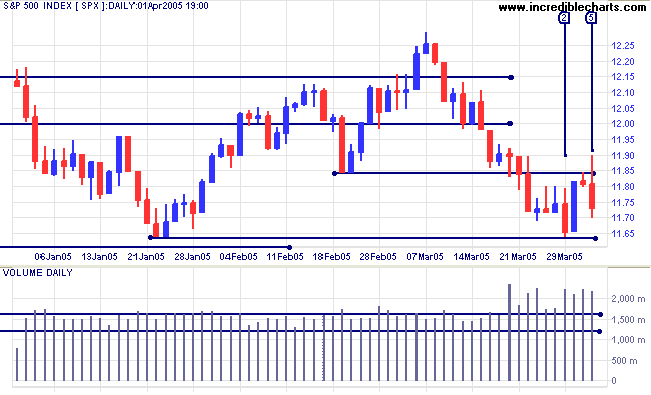
A close below 1160 would signal a primary trend reversal which
should at least test support at 1060.
Twiggs Money Flow (100-day) displays a bearish divergence. A fall below the previous (January) low, or a peak below zero, would add further weight to the bear signal.
Twiggs Money Flow (100-day) displays a bearish divergence. A fall below the previous (January) low, or a peak below zero, would add further weight to the bear signal.
|
|
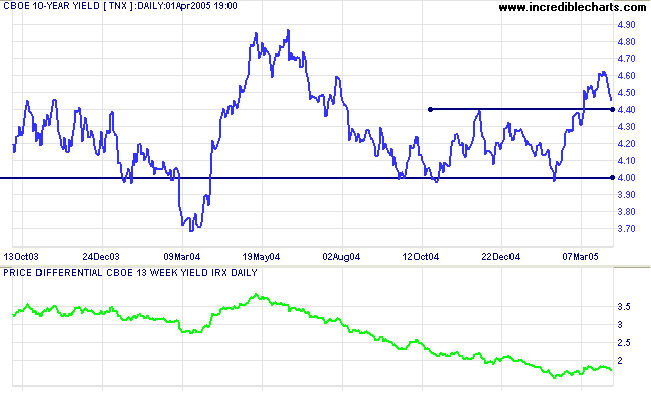
Treasury yields
The yield on 10-year treasury notes is retreating to test support at 4.40%. If support holds, that would signal the start of an up-trend.
The yield differential (10-year T-notes minus 13-week T-bills) has pulled back to 1.7%. A yield differential below 1.0% is considered a long-term bear signal for equity markets.
Gold
New York: Spot gold pulled back to test the new (intermediate) resistance level at $430 before closing lower at $425.30 on Friday. The intermediate trend is downwards and we can expect a test of primary support at $410.
A fall below $410 would signal that the primary trend has reversed; while another secondary peak below $450 would also be a strong bear signal.
ASX Australia
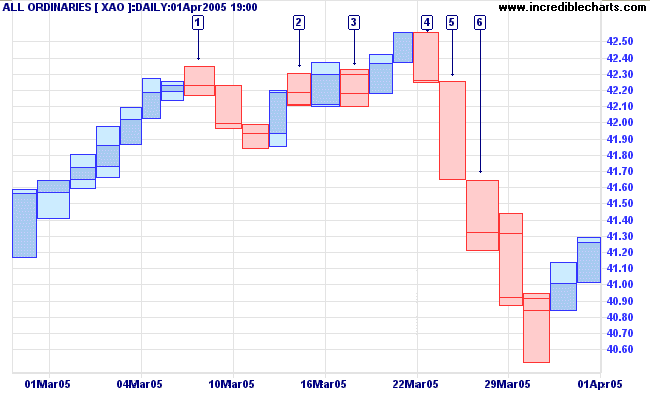
The sharp down-swing on the All Ordinaries encountered support at 4080, with a long tail and strong volume at [2]. The index recovered with two blue candles on Thursday/Friday but on declining volume.
The first level of resistance is at 4180, the previous intermediate low.
The sharp down-swing on the All Ordinaries encountered support at 4080, with a long tail and strong volume at [2]. The index recovered with two blue candles on Thursday/Friday but on declining volume.
The first level of resistance is at 4180, the previous intermediate low.
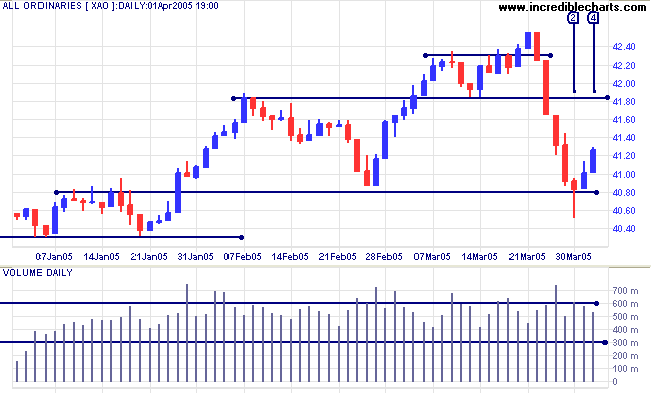
Market confidence in the bull rally has been shaken and we may be
witnessing the start of a market top. There were six
distribution days between March 9 and March 24.
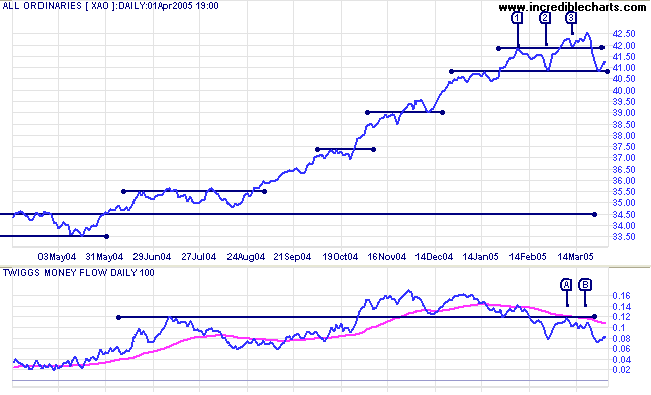
Twiggs Money Flow (100-day) continues to make new
lows, well below the 50-day MA signal line.
The combination of the bear signal from Twiggs Money Flow and the increase in number of recent distribution days favors the formation of a market top. Watch for the following warning signs:
The combination of the bear signal from Twiggs Money Flow and the increase in number of recent distribution days favors the formation of a market top. Watch for the following warning signs:
- increased volatility;
- repeated failure to break through resistance at 4180; or
- a false (marginal) break above the high at 4250; and, most obviously,
- a close below 4080, signaling a primary trend reversal.
Weekly reminder:
At some point there is likely to be a correction back to 3450. This is based on observation of the All Ords over the past 25 years, where the index has regularly cut back to test support at previous highs during an up-trend.
At some point there is likely to be a correction back to 3450. This is based on observation of the All Ords over the past 25 years, where the index has regularly cut back to test support at previous highs during an up-trend.
For further assistance, read About
the Trading Diary.
Colin Twiggs
Nothing is more difficult, and therefore more precious, than to
be able to decide.
~ Napoleon Bonaparte
~ Napoleon Bonaparte
Back Issues
Access the Trading Diary Archives.

Author: Colin Twiggs is a former investment banker with almost 40 years of experience in financial markets. He co-founded Incredible Charts and writes the popular Trading Diary and Patient Investor newsletters.
Using a top-down approach, Colin identifies key macro trends in the global economy before evaluating selected opportunities using a combination of fundamental and technical analysis.
Focusing on interest rates and financial market liquidity as primary drivers of the economic cycle, he warned of the 2008/2009 and 2020 bear markets well ahead of actual events.
He founded PVT Capital (AFSL No. 546090) in May 2023, which offers investment strategy and advice to wholesale clients.