Trading Diary
January 15, 2005
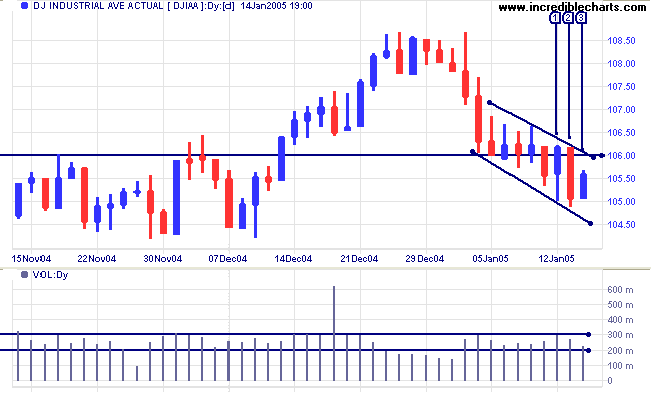
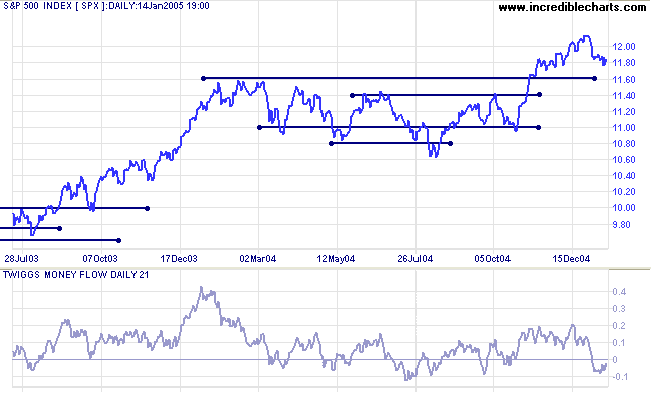
The Dow Industrial Average failed to deliver a bull signal above 10600, edging downwards through the support level.
The index has formed a flag pattern, which generally signals continuation of a trend, so further weakness is likely. Buying support was evident on Wednesday at [1], with increased volume and a strong close. However, this seems to have faded with a large red candle at [2] and lower volume on the blue candle at [3]. Failure to close back above 10600 in the next few days would be a (intermediate) bear signal
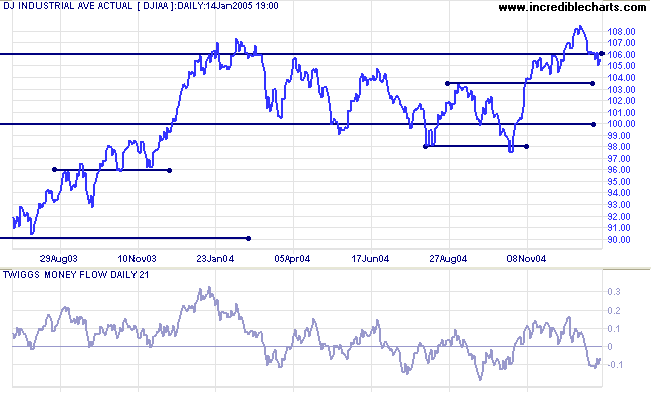
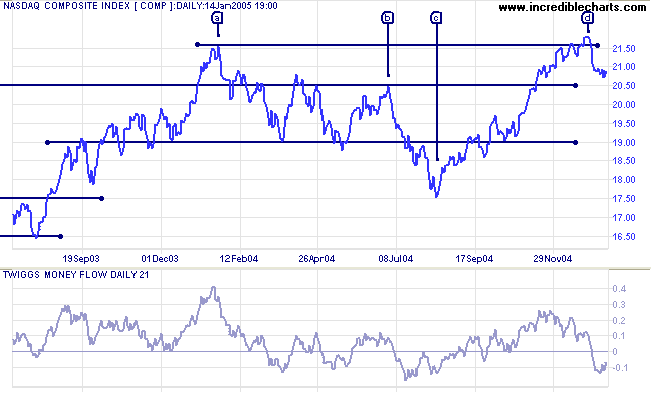
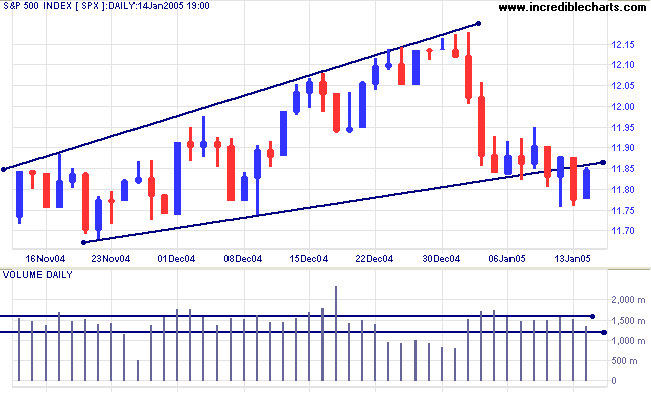
The primary trend direction is still upwards but we may be headed for a period of correction/consolidation. However, if the index holds above initial support levels of 1160 or 1140, that would be a bullish sign.
A fall below major support at 1100 would have (long-term) bearish implications.
|
|
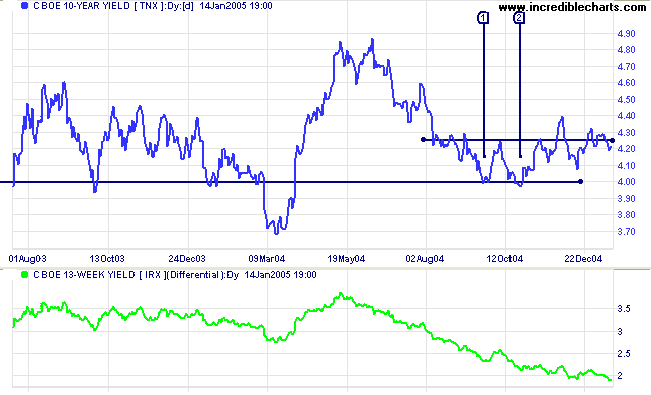
The yield on 10-year treasury notes has consolidated above 4.00% but has so far failed to make further gains. Soft long-term yields indicate that the bond market is holding its own, with no major outflows to equities.
The yield differential (10-year T-notes minus 13-week T-bills) has eased back below 2.0%. A fall below 1.0% would be a long-term bear signal for equity markets.
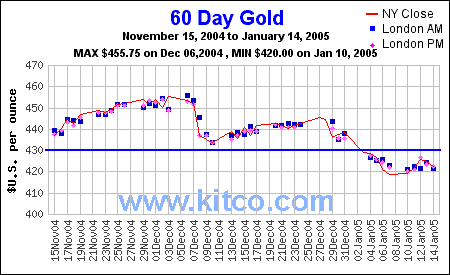
New York: Spot gold rallied briefly but failed to penetrate resistance at $430 and has now fallen back to $422.00. Expect a test of the $400 support level and possibly the 1-year low of $375.
|
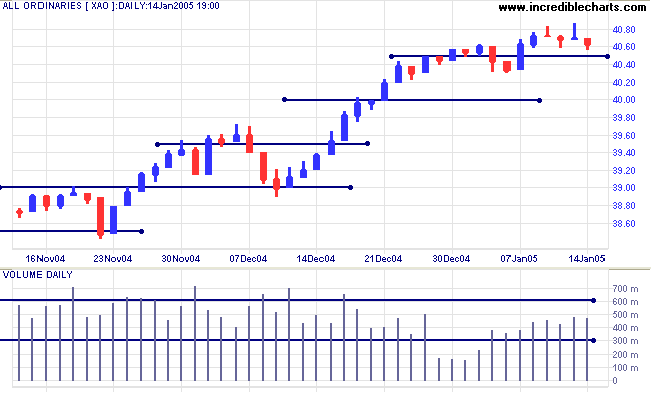
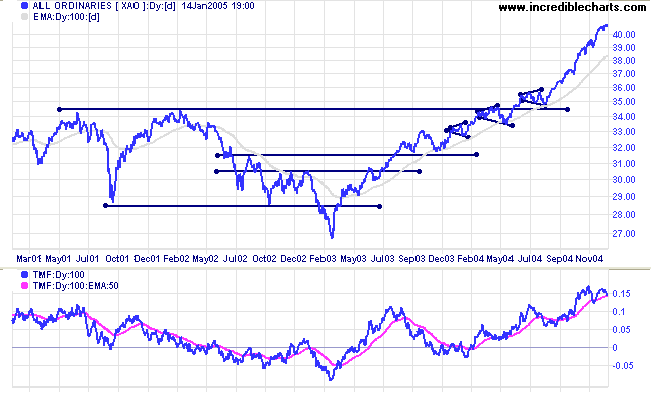
The All Ordinaries displays profit-taking over the last week; a result of bearish sentiment in US equity markets. Tall shadows and long tails over the last 4 days signal consolidation. Increased volume tells us that selling is being met by equally strong buying. This warns that there is likely to be a strong move in the week ahead; the direction of the move will be signaled by a break above the last week's high or below the week's low.
without sensing that here ideas are governed by other factors,
that the light of reason is refracted in a manner quite different
from that which is normal in academic speculation.
~ Claus von Clausewitz: Vom Kriege ("On War") (1831)
(the intensity of emotions in trading similarly refract the light of reason)
Back Issues

Author: Colin Twiggs is a former investment banker with almost 40 years of experience in financial markets. He co-founded Incredible Charts and writes the popular Trading Diary and Patient Investor newsletters.
Using a top-down approach, Colin identifies key macro trends in the global economy before evaluating selected opportunities using a combination of fundamental and technical analysis.
Focusing on interest rates and financial market liquidity as primary drivers of the economic cycle, he warned of the 2008/2009 and 2020 bear markets well ahead of actual events.
He founded PVT Capital (AFSL No. 546090) in May 2023, which offers investment strategy and advice to wholesale clients.
