Trading Diary
January 8, 2005
The Dow Industrial Average has so far consolidated above support at 10600.
A successful test of support would be a strong bull signal, signaling a likely rally targeting resistance at 11400. Modest volumes are an encouraging sign while the index holds above the support level, signaling the absence of selling pressure. A rise above Thursday's high of 10670, accompanied by stronger volumes, would add further confirmation
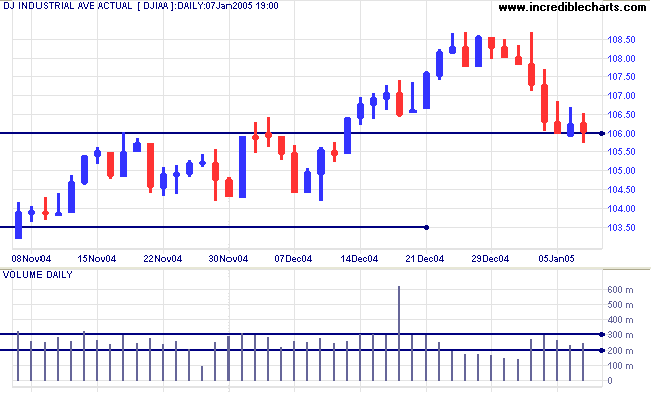
A fall below 10000 would be a (long-term) bear signal.
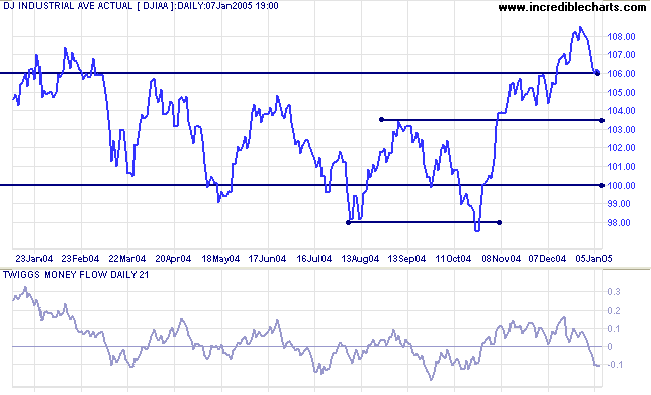
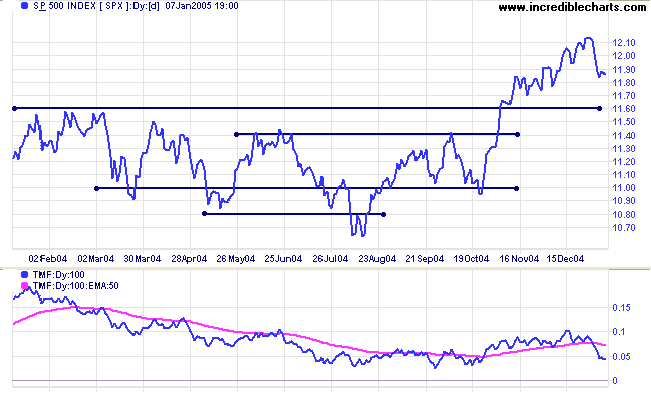
Twiggs Money Flow (21-day) has fallen sharply below zero, signaling distribution.
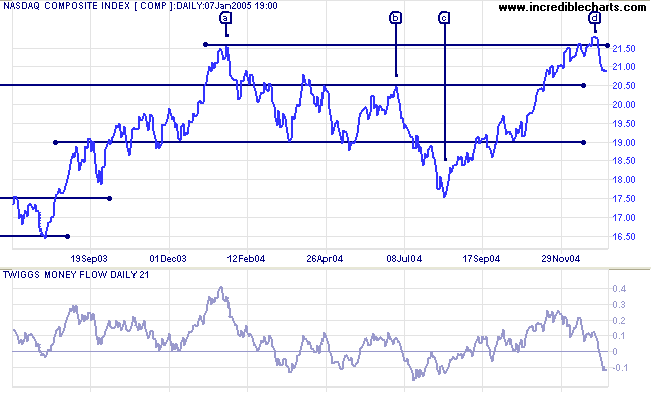
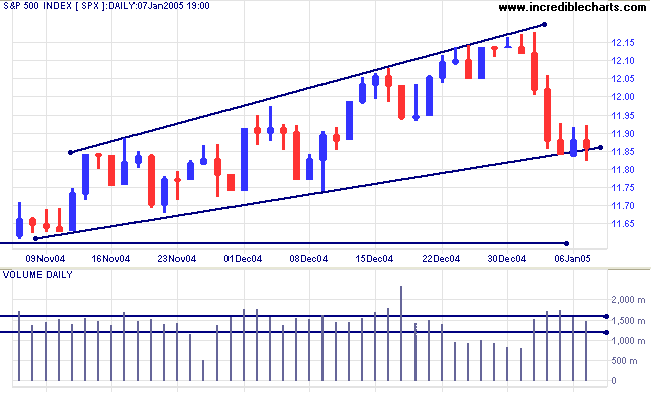
The primary trend direction is still upwards but we may be headed for a period of correction/consolidation. The first level of support is at 1160, with major support at 1100.
|
|
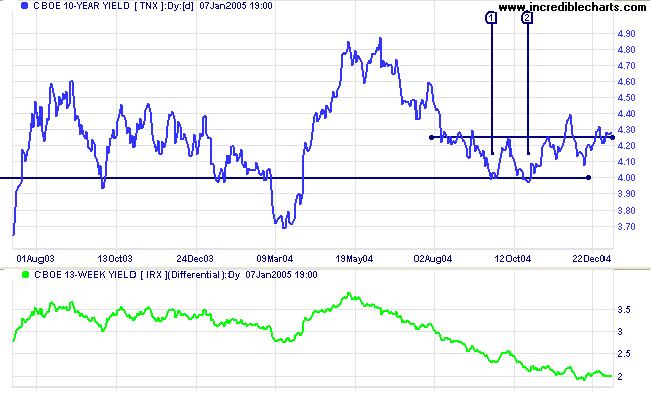
The yield on 10-year treasury notes has edged above resistance at 4.25%. Soft long-term yields indicate that the bond market is holding its own, with no major outflows to equities markets.
The yield differential (10-year T-notes minus 13-week T-bills) is holding at 2.0%. A fall below 1.0% would be a long-term bear signal.
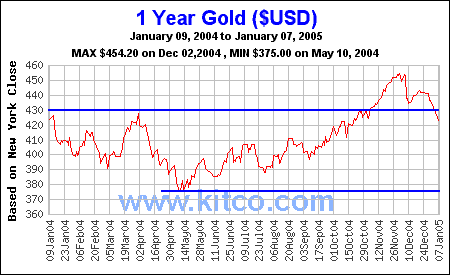
New York: Spot gold has broken through the first level of support at $430 and is currently trading at $418.40. Apart from the psychological barrier of $400, major support is at the 1-year low of $375.
|
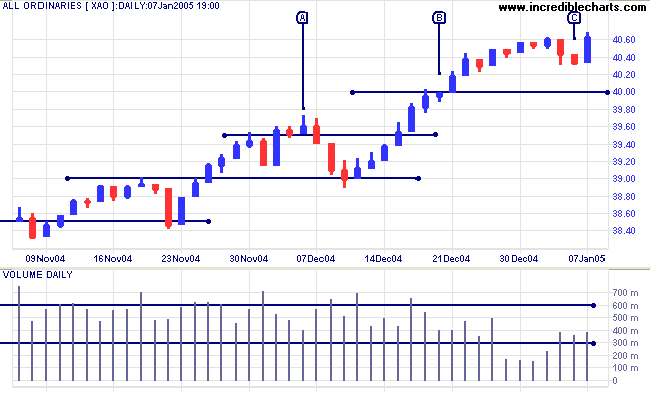
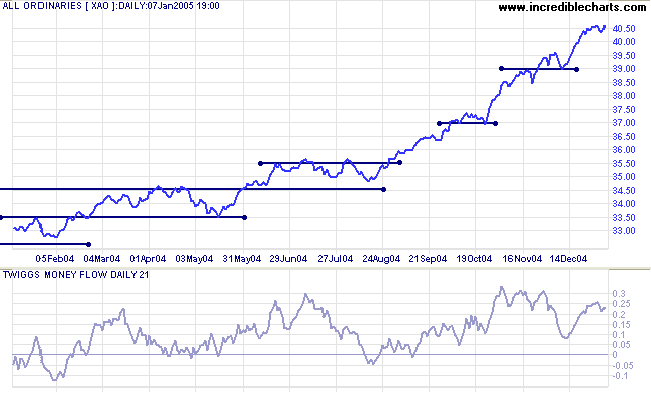
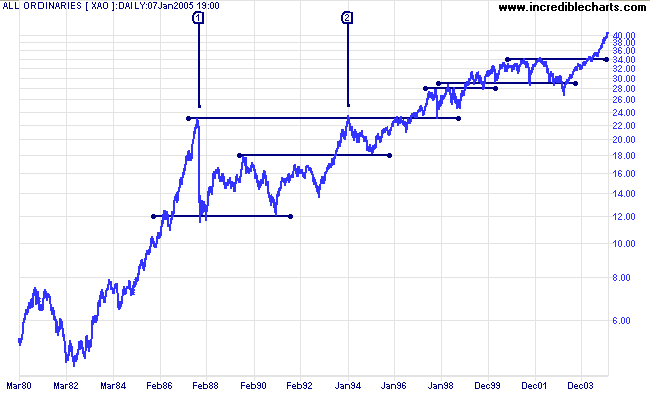
Despite bearish rumblings from US markets, the All Ordinaries retraced the last two days downswing with a tall blue candle on average volume. The short pull-back at [C] on modest volume and the lack of serious resistance at the 4000 level (the index consolidated for a single day at [B] on lower volume) both indicate that the ASX is in a bull market. And those of you who follow Bill McLaren will recognize the space between the latest low [C] and the previous high [A]: signaling a fast up-trend.
We wish you peace, health and prosperity in the year ahead.
Regards,
~ Teddy Roosevelt
Back Issues

Author: Colin Twiggs is a former investment banker with almost 40 years of experience in financial markets. He co-founded Incredible Charts and writes the popular Trading Diary and Patient Investor newsletters.
Using a top-down approach, Colin identifies key macro trends in the global economy before evaluating selected opportunities using a combination of fundamental and technical analysis.
Focusing on interest rates and financial market liquidity as primary drivers of the economic cycle, he warned of the 2008/2009 and 2020 bear markets well ahead of actual events.
He founded PVT Capital (AFSL No. 546090) in May 2023, which offers investment strategy and advice to wholesale clients.
