Trading Diary
November 20, 2004
These extracts from my daily trading diary are for educational
purposes and should not be interpreted as investment advice. Full
terms and conditions can be found at Terms
of Use.
USA
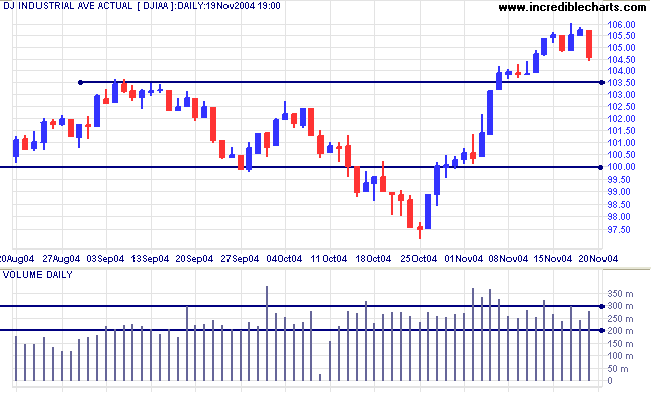
The Dow Industrial Average is about to test the new 10350 support level. A strong red candle on average volume signals that sellers have gained control. A successful test of the new support level would signal a strong up-trend. Failure of this level would signal trend weakness.
The Dow Industrial Average is about to test the new 10350 support level. A strong red candle on average volume signals that sellers have gained control. A successful test of the new support level would signal a strong up-trend. Failure of this level would signal trend weakness.
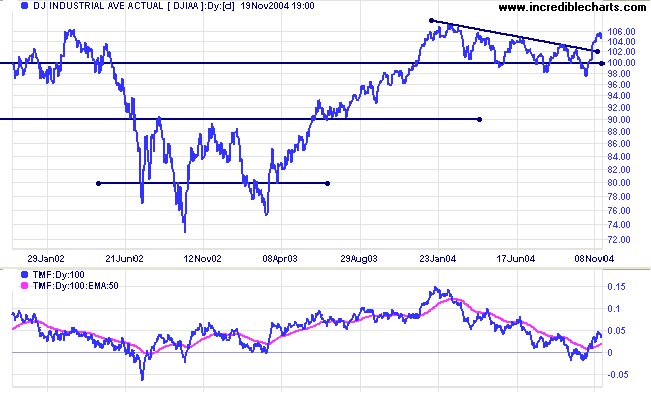
The longer-term chart displays the breakout above the
consolidation pattern. A failure of support at 10350 would not be
a long-term signal, provided that support at 10000 holds. Failure
of the major 10000 support level would be a long-term bear
signal.
Overhead resistance is at 11000, with the next major level at 11400 to 11500.
Twiggs Money Flow signals strong accumulation.
Overhead resistance is at 11000, with the next major level at 11400 to 11500.
Twiggs Money Flow signals strong accumulation.
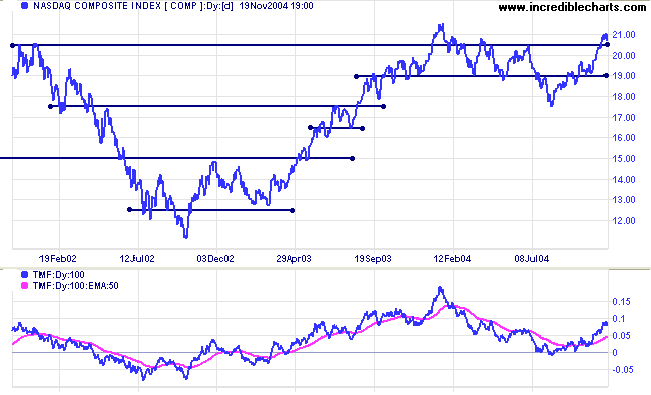
After breaking through resistance at 2050, the Nasdaq
Composite is likely to pull back to test the new support
level. The primary trend is now up and a successful test of 2050
will signal a strong up-trend.
Twiggs Money Flow continues to signal strong accumulation, rising well above the signal line.
Twiggs Money Flow continues to signal strong accumulation, rising well above the signal line.
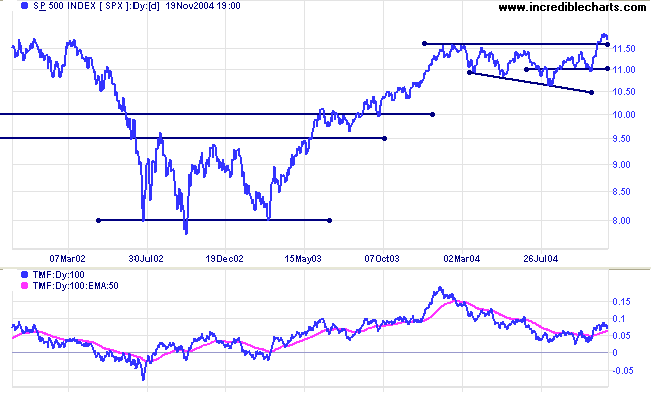
The S&P 500 has also started a pull-back and is likely
to test support at 1150/1160. A successful test would signal a
strong up-trend and, with no major resistance levels in the
vicinity, we can expect good gains. The projected target for the
broadening wedge breakout is 1240: 1140 + ( 1160 - 1060).
Twiggs Money Flow continues to signal strong accumulation.
Twiggs Money Flow continues to signal strong accumulation.
|
|
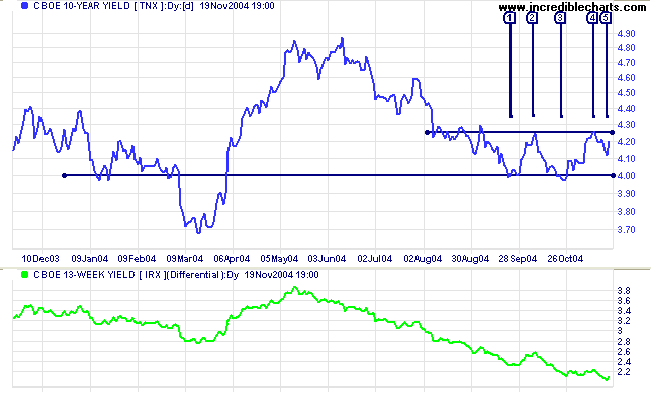
Treasury yields
The yield on 10-year treasury notes has failed to break out from the double bottom pattern at [1] and [3]. However, the short pull-back at [5] may signal that another attempt is imminent.
The yield differential (10-year T-notes minus 13-week T-bills) has fallen to 2.1%. Differentials below 1.0% are bearish.
Gold
New York: Spot gold has rallied to close at $446.40 on Friday. Support is at $430 and any correction is likely to test that level.
If successful, we can look forward to further gains, with the next major resistance level at 500.
New York: Spot gold has rallied to close at $446.40 on Friday. Support is at $430 and any correction is likely to test that level.
If successful, we can look forward to further gains, with the next major resistance level at 500.
|
ASX Australia
The ASX 200 is losing momentum, having failed to make any further gains after Monday's blue candle. Strong volume and a weak close on Thursday [T] signal resistance at 3880 and we may see a test of support at 3850 (level 1) or 3820 (level 2). If the index respects level 1, from the previous peak, that would indicate trend strength; whereas a test of level 2, the previous trough, would signal that buyers and sellers are more evenly matched and some form of consolidation is taking place.
The ASX 200 is losing momentum, having failed to make any further gains after Monday's blue candle. Strong volume and a weak close on Thursday [T] signal resistance at 3880 and we may see a test of support at 3850 (level 1) or 3820 (level 2). If the index respects level 1, from the previous peak, that would indicate trend strength; whereas a test of level 2, the previous trough, would signal that buyers and sellers are more evenly matched and some form of consolidation is taking place.
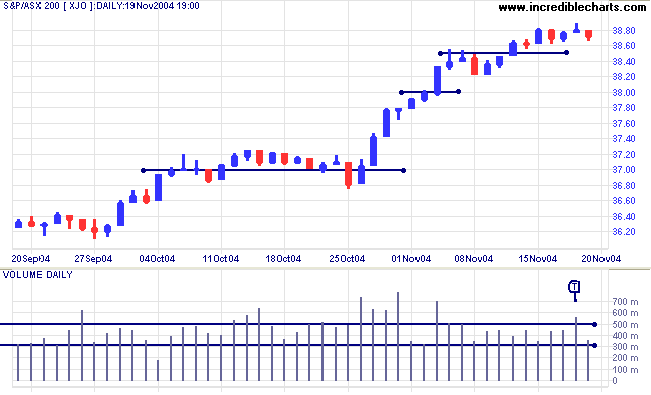
Twiggs Money Flow is rising steeply, signaling strong
accumulation.
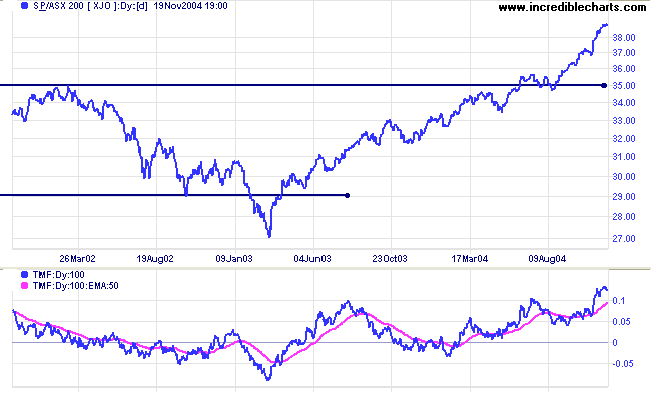
The primary up-trend is strong. The latest rally is unusually steep and at some stage (perhaps 4000) increased profit-taking will force a correction. The first major support level is at 3500 (the highs of 2002).
The primary up-trend is strong. The latest rally is unusually steep and at some stage (perhaps 4000) increased profit-taking will force a correction. The first major support level is at 3500 (the highs of 2002).
For further assistance, read About
the Trading Diary.
Colin Twiggs
Those who too lightly agree will necessarily be
trusted by few;
And those who regard many things as easy will necessarily end up with many difficulties.
Therefore, even the Sage regards things as difficult,
And as a result, in the end has no difficulty.
~ Lao Tse
And those who regard many things as easy will necessarily end up with many difficulties.
Therefore, even the Sage regards things as difficult,
And as a result, in the end has no difficulty.
~ Lao Tse
Back Issues
Access the Trading Diary Archives.

Author: Colin Twiggs is a former investment banker with almost 40 years of experience in financial markets. He co-founded Incredible Charts and writes the popular Trading Diary and Patient Investor newsletters.
Using a top-down approach, Colin identifies key macro trends in the global economy before evaluating selected opportunities using a combination of fundamental and technical analysis.
Focusing on interest rates and financial market liquidity as primary drivers of the economic cycle, he warned of the 2008/2009 and 2020 bear markets well ahead of actual events.
He founded PVT Capital (AFSL No. 546090) in May 2023, which offers investment strategy and advice to wholesale clients.